
Figures & data
Figure 1. The number and percentage of East-Asian faculty members in the top 100 PA schools.
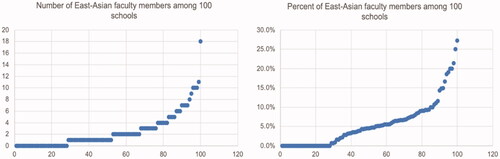
Table 1. Descriptive statistics of East-Asian full-time faculty and tenured East-Asian faculty (N = 100 schools)
Table 2. Comparison of East-Asian PhD graduates with other PhD graduates
Figure 2. East-Asian scholars’ publications in top 10 PA journals.
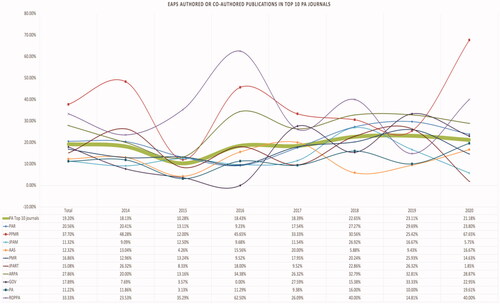
Table 3. Journal editorial board and the share of East-Asian members
Figure 3. East-Asian scholars’ presentations in academic conferences (2017–2020). ASPA 2020 conference was canceled due to COVID-19. Accepted manuscripts were presented at the 2021 conference. The 2020 ASPA number in this figure refers to the 2021 presentations.

Table 4. East-Asian awardees with academic associations (2017–2021)
Table 5. Representation of East-Asian scholars in associations’ leadership (2020).