
Figures & data
Table 1. Official resource estimates (complying with the PERC Code) for the Liikavaara Östra Cu-(W-Au) deposit (date: 2018.12.31). Tungsten and Mo are currently not considered for production but Mo might be produced in the future.
Figure 1. Location of the Liikavaara Östra Cu-(W-Au) deposit and geology of the Gällivare area (modified from Martinsson & Wanhainen Citation2004). The SWEREF99 TM coordinate system is used. Note, all rocks are metamorphosed, the prefix “meta-” is left out to keep rock names short.
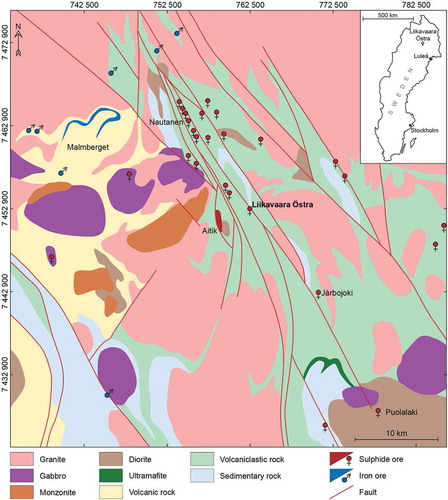
Figure 2. Geological map and profile A-B of the Liikavaara Östra Cu-(W-Au) deposit. The SWEREF99 TM coordinate system is used. A. Plan view of the Liikavaara Östra Cu-(W-Au) deposit at 100 m below surface. Numbered drill holes marked in white were studied and sampled during this study. B. Cross section from A to B through the deposit. The deepest drill hole reaches a depth of approximately 500 m below surface.
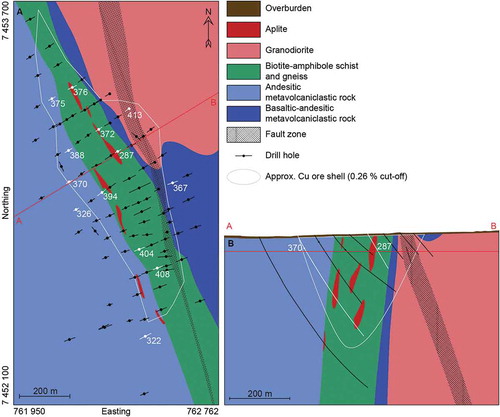
Figure 3. Drill cores sampled for whole rock analysis and mineralogical studies. Depth of each sample is shown. Whole rock samples are to the left of each drill core, mineralogical samples to the right. Samples in italic letters were collected to support the whole rock data with petrographic observations. Samples in bold were targeted at mineralogy of specific metals (metals of interest are listed above each drill core). The remaining samples were collected to study vein and mineralisation mineralogy.
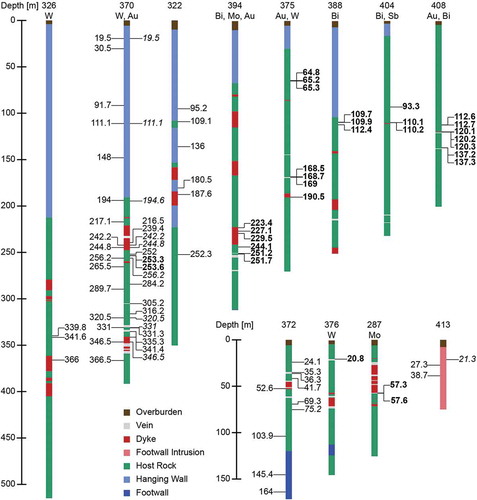
Table 2. The instrument settings of the LA-MC-ICP-MS used for U/Pb-analysis on zircons at the Vegacenter micro-analytical facility at the Swedish Museum of Natural History in Stockholm, Sweden. The zircons were sampled from an intrusion in the footwall of the Liikavaara Östra Cu-(W-Au) deposit suggested to be associated with its formation.
Figure 4. Drill core images of the different rock types at Liikavaara (A–G) and vein-, alteration- and mineralisation-styles (H–M). A. Hanging wall (metavolcaniclastic rock). B. Hanging wall (clast-rich metavolcaniclastic rock). C. Host rock (biotite schist). D. Aplite dyke. E. Host rock (amphibole gneiss). F. Footwall (metavolcaniclastic rock). G. Footwall intrusion (granodiorite). H. Porphyritic aplite dyke. I. Foliated aplite dyke with thin quartz-tourmaline-sulphide veins parallel to foliation. J. Quartz-calcite veins in biotite schist, parallel to foliation. Some sulphides occur in the veins, especially molybdenite at the borders. A dark selvage of biotite, tourmaline and epidote is developed at the contact of the largest quartz vein within the biotite schist (see black rectangle). K. Cross-cutting quartz-calcite vein in biotite schist. The biotite schist transitions to amphibole gneiss towards the bottom. L. Deformed quartz-calcite-sulphide vein in biotite-amphibole schist. M. Quartz-tourmaline-calcite-sulphide vein. Chalcopyrite fills interstices between tourmaline grains and more massive chalcopyrite and pyrrhotite extend into quartz. Several scheelite grains occur in the quartz-rich part of the vein (within the black rectangle).
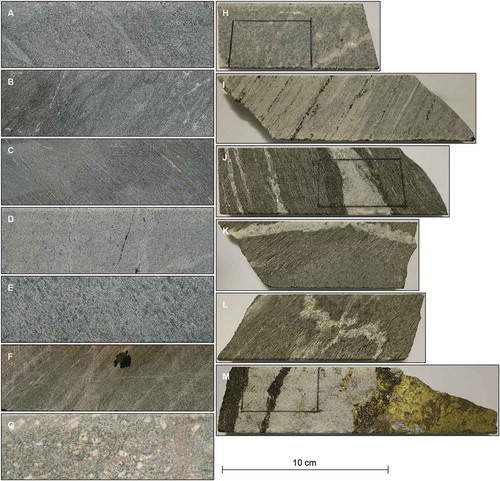
Figure 5. Transmitted light photomicrographs of the various rocks in the Liikavaara Östra Cu-(W-Au) deposit. A. Euhedral plagioclase phenocrysts in the matrix of a metavolcaniclastic rock of the hanging wall. B. Altered feldspar phenocrysts in the matrix of a metavolcaniclastic rock of the footwall. C. Amphibole gneiss. D. Biotite-amphibole gneiss. E. Biotite schist. F. Granodiorite. G. Aplite. H. Biotite-altered aplite. I. Quartz-dominated aplite. J. Muscovite-altered quartz-dominated aplite. Note: 5 C is taken with plane polarised light, the rest with crossed polarised light. Abbreviations: Amph – amphibole, Bt – biotite, Cal – calcite, Ep – epidote, Feld – feldspar, Mc – microcline, Ms – muscovite, Pl – plagioclase, Qz – quartz, Seri – sericite.
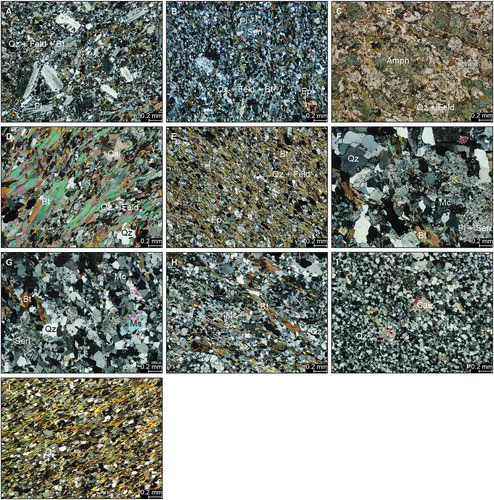
Figure 6. Classification of rock types in Liikavaara based on three sets of whole rock chemical data. One set was analysed in this study, one set is from Estholm (Citation2014) and one set is from Boliden AB (environmental samples). A. Volcanic TAS diagram by Le Maitre et al. (Citation1989). Data are shifted towards more trachytic composition compared to C and D. B. Igneous Spectrum plot by Hughes (Citation1973). Data of the wall rocks and footwall intrusion plot mainly within the igneous spectrum, only a few hanging wall samples show Na-metasomatic alteration. In contrast, most data of the host rock and dykes show K-metasomatic alteration. C. Modified immobile element ratio plot by Pearce (Citation1996). Composition is variable between basaltic (host rock) and andesitic (hanging wall) with the footwall in between. Dykes and the intrusion are more felsic. D. Immobile element classification diagram for deeply weathered rocks by Hallberg (Citation1984). Although not deeply weathered, strong hydrothermal alteration of the host and wall rocks make this diagram interesting. The results are consistent with the classification after Pearce (Citation1996). E. AFM diagram after Kuno (Citation1968) and Irvine & Baragar (Citation1971). Most data lie in the calc-alkaline field. F. R1-R2 plutonic chemical variation diagram by De La Roche et al. (Citation1980). Only data of intrusive rocks (dykes and footwall intrusion) are plotted excluding the strongly altered host rock. Most data plots in the granite field. G. IUGS QAP plutonic rock classification diagram. Normative calculation was performed on data used in F. Dyke data lie in the monzogranite field, footwall intrusion data on the alkali side of the granodiorite field.
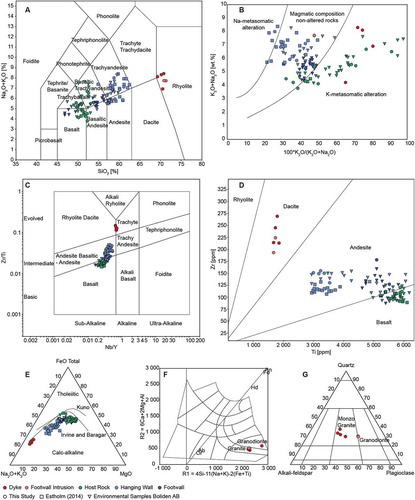
Figure 7. A. Relative concentration of various metals over 124 drill cores intersecting the Liikavaara Östra Cu-(W-Au) deposit. Each dot represents a value measured for a section in a drill core. Note that sections vary in length and values are not normalised, consequently concentrations are not actual metal grades. Analysis of older drill cores covered a smaller suit of elements which is why some elemental maps (e.g. Bi, Sb etc.) are represented by fewer dots than others. The approximate 0.26 % Cu ore shell is shown as a black line in each map as visual reference. The SWEREF99 TM coordinate system is used. B. Downhole grades of metals in drill core 394 in the Liikavaara Östra Cu-(W-Au) deposit. Metals are enriched in the host rock and especially within and in proximity to aplite dykes and veins. Copper, W, Au, Ag and Bi show a similar distribution pattern. Molybdenum also shares their major peak. Zink and Pb are similar to each other but show a different distribution than the other metals. S shows, as expected, a mixture of the two groups.
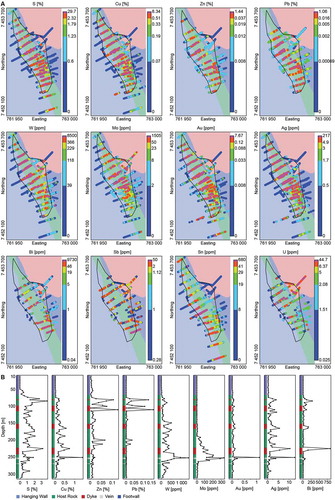
Figure 8. Transmitted light microphotograph images of veins in the Liikavaara Östra Cu-(W-Au) deposit. A. Quartz-tourmaline-calcite vein with mineralisation of scheelite and sulphides; scheelite occurs with quartz, sulphides with tourmaline. B. Calcite-sulphide vein crosscutting a quartz vein in biotite schist. C. Biotite selvage around a quartz vein. D. Quartz-calcite-sulphide vein in biotite schist. Note: 9a taken with parallel polarisers, rest crossed polarisers. Abbreviations: Bt – biotite, Cal – calcite, Qz – quartz, Sch – scheelite, Sulp – sulphide, Tour – tourmaline.
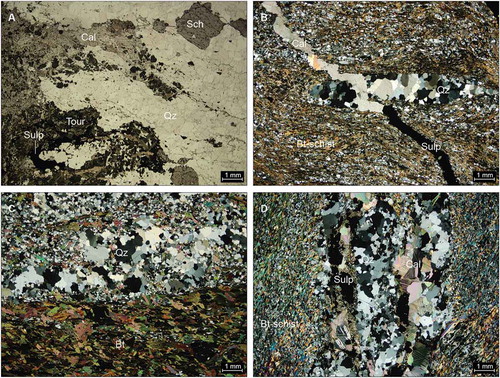
Figure 9. Reflected light (G–H) and backscattered electron (I, J) images of the mineralisation at the Liikavaara Östra Cu-(W-Au) deposit. A. Chalcopyrite and pyrrhotite surrounded by calcite in a quartz vein. B. Pyrite and pyrrhotite with quartz in aplite. C. Skeletal pyrite and marcasite replacing chalcopyrite associated with pyrrhotite and scheelite in a quartz vein. D. Assemblage of chalcopyrite, pyrrhotite, sphalerite and galena in a quartz-tourmaline-calcite vein. E. Molybdenite associated with chalcopyrite, pyrite and pyrrhotite in a quartz vein. F. Scheelite grains partly associated with chalcopyrite and pyrrhotite in a quartz vein within aplite. G. Disseminated chalcopyrite, pyrite, pyrrhotite and magnetite in biotite schist. H. Intergrowth of a Bi-telluride and a Bi-Te-sulphide next to sphalerite in a quartz vein. I. Cassiterite inclusions at the edge of pyrite next to biotite. J. Euhedral uraninite with calcite and galena in a chalcopyrite-filled crack within scheelite. Abbreviations: Cal – calcite, Ccp – chalcopyrite, Cst – cassiterite, Gn – galena, Mcs – marcasite, Mgt – magnetite, Mol – molybdenite, Po – pyrrhotite, Py – pyrite, Qz – quartz, Sch – scheelite, Sp – sphalerite, Urn – uraninite.
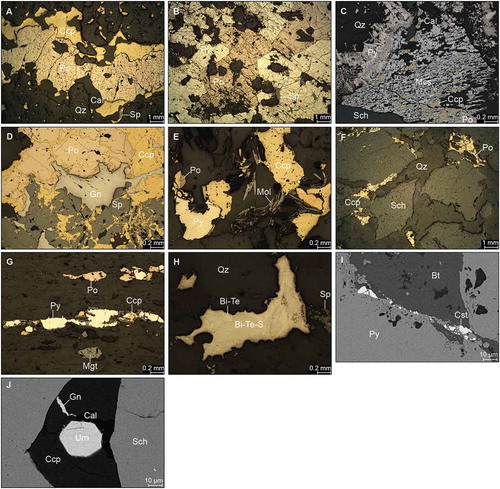
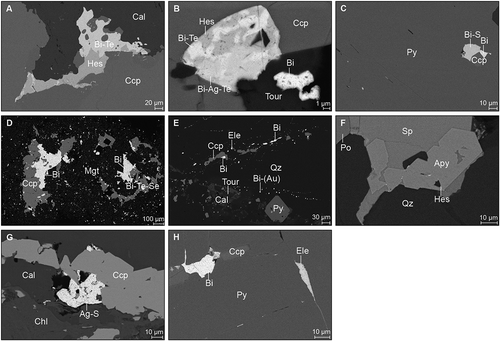
Figure 10. Backscattered electron images of various Bi, Ag and Au minerals in the Liikavaara Östra Cu-(W-Au) deposit. A. Intergrowth of a Bi-telluride and hessite at the edge of chalcopyrite and associated with calcite. B. Intergrowth of hessite, a Bi-telluride and a Bi-Ag-telluride in chalcopyrite next to native Bi. C. Inclusion of native Bi and a Bi-sulphide associated with chalcopyrite in pyrite. D. Disseminated native Bi and Bi-Te-Se associated with chalcopyrite and magnetite. E. Droplet-shaped grains of native Bi with some gold in quartz. F. Hessite at the edges of arsenopyrite intergrown with sphalerite. G. An Ag-sulphide at the border of chalcopyrite and associated with calcite and chlorite. H. Electrum in a crack in pyrite and inclusion of native Bi with chalcopyrite. Abbreviations: Apy – arsenopyrite, Cal – calcite, Ccp – chalcopyrite, Chl – chlorite, Ele – electrum, Hes – hessite, Mgt – magnetite, Po – pyrrhotite, Py – pyrite, Qz – quartz, Sp – sphalerite, Tour – tourmaline.
5.6. A. Backscattered electron images of zircons. Ages marked with “**” are corrected for common Pb. The crystals are sub- to euhedral, stubby to elongated in shape and roughly 50–200 µm in size. Crystals 1–5 and 7 show oscillatory zoning. In crystals 2, 3 and 5 spots intersect several zones close to the rim of the crystals and give mixed discordant 207Pb–206Pb ages younger than the crystallisation age of the unit. In crystals 1, 2, 4, and 5 spots in the bright part of the core provide concordant 207Pb–206Pb ages close to the crystallisation age of the unit. For Crystals 4–8 the BSE images show a dark area in the central part of the core with cracks originating from it. Spots in these areas give discordant 207Pb–206Pb ages younger than the crystallisation age of the unit and often younger than the zoned rims. Crystal 8 has a spot in the bright part of the core of discordant age. This is due to overlap with a fracture. The same crystal shows inclusion of white Pb-phases in the dark part of the core. These Pb-phases when intersected by an analysis cause erroneous data due to IC tripping. B. Reverse concordia (Tera-Wasserburg) diagram with intercept ages for the discordia covering 66 analyses from various areas within 58 zircons. C. Concordia age calculation based on 20 concordant analyses from spots in the bright area in the cores of the zircons. D. Calculated 207Pb–206Pb weighted average age of the same 20 analyses as in C.
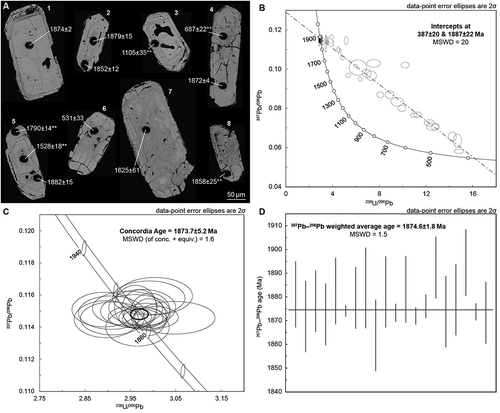
Figure 12. Paragenetic sequence of mineralisation at the Liikavaara Östra Cu-(W-Au) deposit. Approximate timing of quartz-tourmaline-calcite veins and calcite veins is indicated. Mineralisation earlier than veins is found disseminated in the host rock.
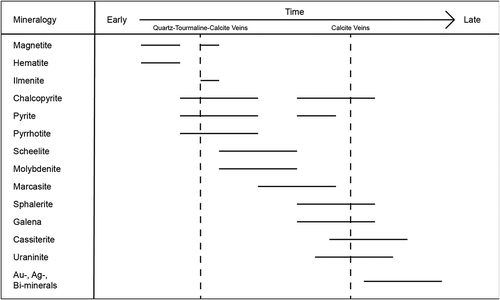
Table A1. Method of sample preparation and analysis for the various chemical data sets handled in this study. Abbreviations: AD – Acid Digestion, AR – Aqua Regia, ICP-(A)ES – Inductively Coupled Plasma (Atomic) Emission Spectroscopy, ICP-MS – Inductively Coupled Plasma Mass Spectrometry, FD – Fused Disc, LBF – Lithium borate fusion, MA – Multi Acid, XRF – X-ray fluorescence.
Vegacenter_Data.xlsx
Download MS Excel (752.9 KB)Data availability statement
The chemical data from Boliden AB that support the findings of this study are available from Boliden AB. Restrictions apply to the availability of these data, which were used under licence for this study. Other chemical data that support the findings of this study are available from the corresponding author, M.W., upon reasonable request. The authors confirm that the geochronological data supporting the findings of this study are available within the article or its supplementary materials.