Figures & data
Figure 1. Geology of the surroundings of the Baltic Bea basin. Source and sink area for Pleistocene glacial erosion and deposition shown in red. TH Trollhättan. Upp Uppland.
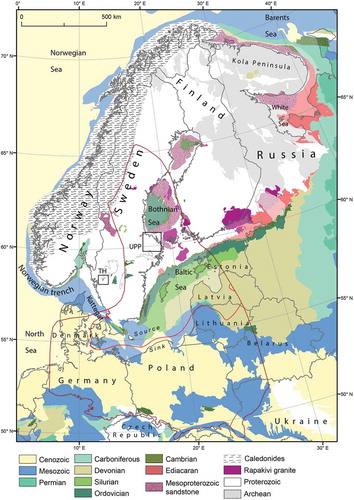
Figure 2. The Baltic Sea basin and its bathymetry in relation to Pleistocene ice limits and ice flow lines. W Late Weichselian. Wa Warte. S1 Sanian 1, E Elsterian. S Saalian. Pleistocene ice limits are from Marks et al. (Citation2018). Bathymetric data from European Marine Observation and Data Network.
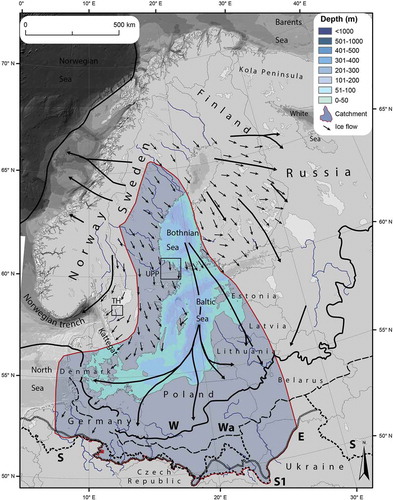
Figure 3. Cross-section of the Baltic Sea basin today and at 60 ka in the future after residual glacial isostatic rebound is complete. Line of section indicated on . The long profile of the Orinoco River is added for comparison. Residual isostatic rebound at 60 ka after Näslund (Citation2006).
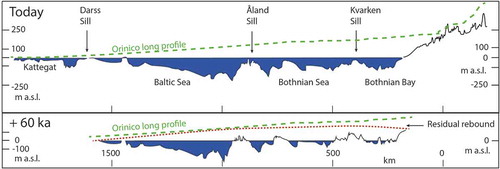
Figure 4. Bathymetry and major landforms of the Baltic Sea. Bathymetric data from European Marine Observation and Data Network, EMODnet Digital Bathymetry (DTM 2018). EMODnet Digital Bathymetry (DTM) was accessed on 14 October 2019 at http://doi.org/10.12770/18ff0d48-b203-4a65-94a9-5fd8b0ec35f6. Major erosional basins, trenches and scarps are named. Eemian marine sediment localities from Miettinen et al. (Citation2002) and Funder et al. (Citation2002).
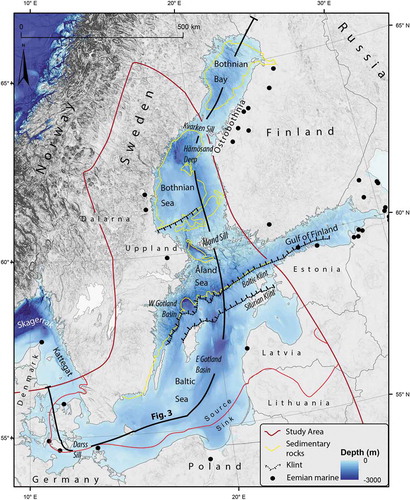
Figure 5. A. Source and sink areas for the Baltic Sea basin. Arrows indicate inputs and outputs of sediment outside the main source-sink area used for the sediment budget. B. Schematic representation along a NW-SE transect of the basement and sedimentary rock components removed from different terrains in the source area. Line of section indicated on Fig. 5A.
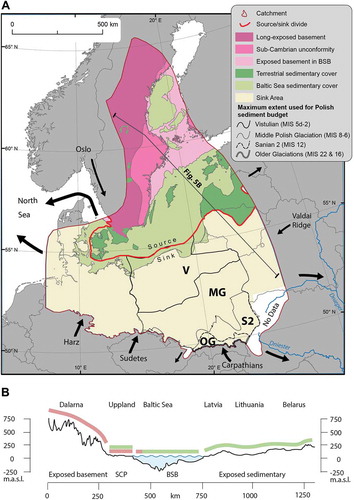
Table 1. Source area erosion.
Table 2. Sink area sediment volume.
Figure 6. Surface elevation, base Quaternary elevation and Quaternary sediment isopachs in the sink area. See text for data sources.
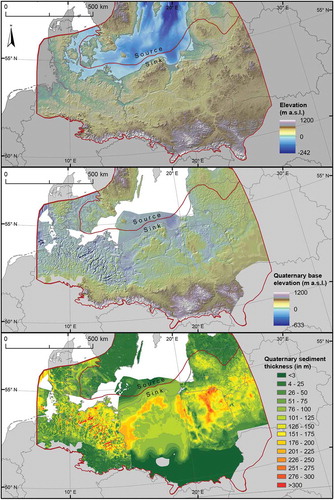
Table 3. Sediment in Poland.
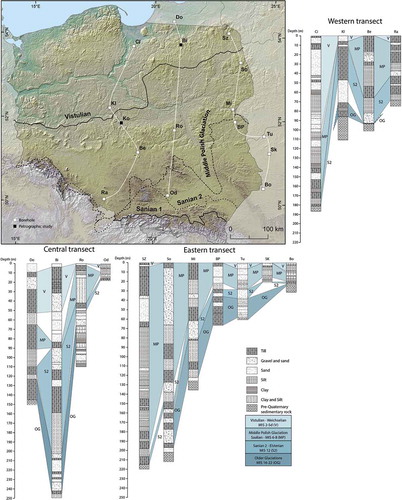
Figure 7. Pleistocene sediment in boreholes along three N-S transects in Poland and westernmost Belarus. Pleistocene ice limits are from Marks et al. (Citation2018).