
Figures & data
Table 1. Details concerning the received rehabilitative services in the trial period.
Figure 1. Characteristics of the ICC-OT intervention.
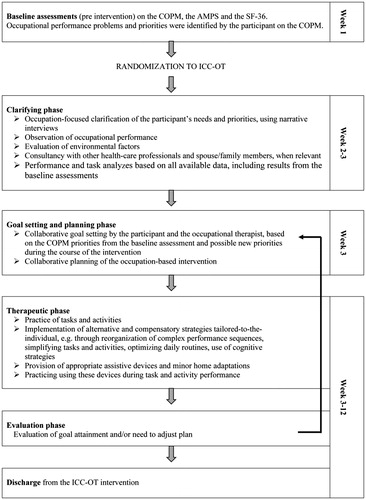
Figure 2. Participant flow.
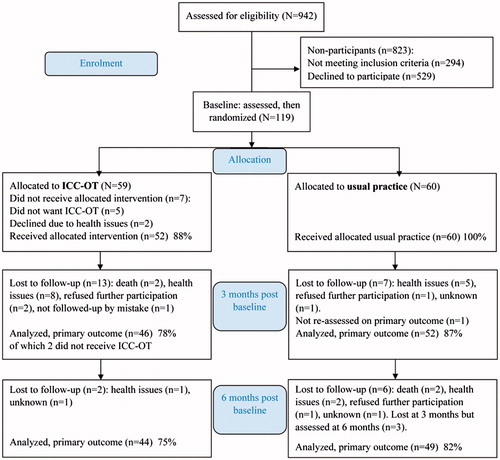
Table 2. Demographics and baseline measurements for both groups.
Table 3. Occupational performance and health related quality of life. Within-group changes and between group differences in change.
Figure 3. COPM performance at baseline and at 3 months.
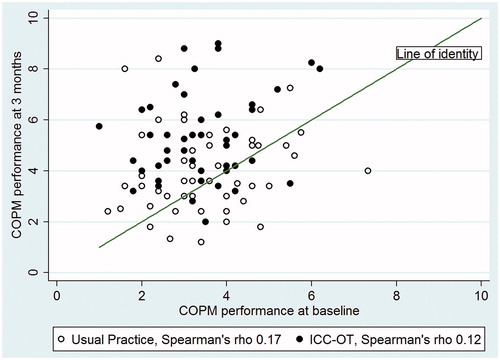
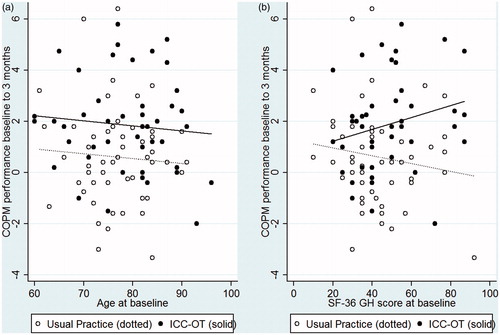
Figure 4. (a,b) Exploratory analyses of age and health status' influence on change in COPM from baseline to 3 months.
Appendix 1. Occupational performance and health related quality of life.
Mean scores and between group differences at 3 and 6 months