
Figures & data
Table 1. Characteristics of the participating children and the children of participating parents.
Figure 1. Conception of the KIDSCREEN-27 dimensions [Citation29].
![Figure 1. Conception of the KIDSCREEN-27 dimensions [Citation29].](/cms/asset/d99c8e11-2f9f-405d-a272-0b59ce11dff3/iocc_a_1509371_f0001_b.jpg)
Figure 2. Life quality scores based on self- and proxy-reports in both groups of children.
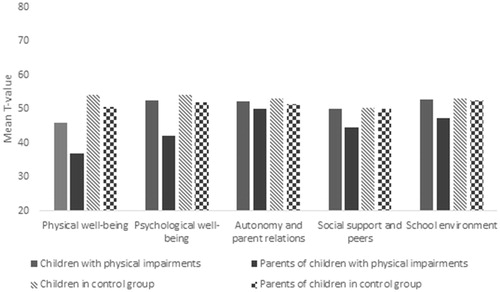
Table 2. Comparison of children’s and parents’ ratings: Independent sample t-tests and effect sizes.