
Figures & data
Table 1. Demographic characteristics of participants at baseline.
Table 2. Proportion of participants and comparison of engagement in activities at baseline in CG and IG.
Figure 1. The flow of participants through promoting aging migrants’ capabilities study and the reasons for declining participation at 6 months and 1 year follow-ups.
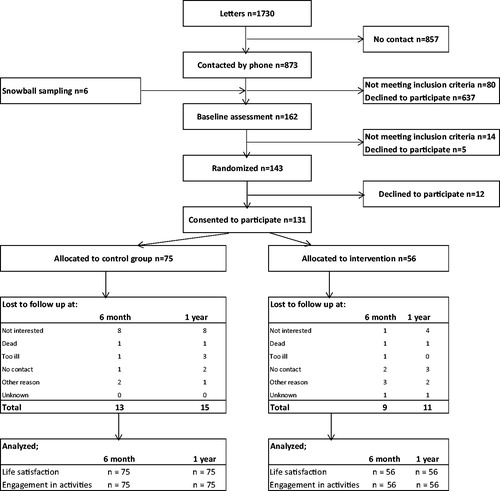
Table 3. Differences in proportion of dropouts and participants at 6 months and 1 year.
Table 4. Amount of participants who evaluate their life satisfaction as satisfactory at baseline.
Table 5. Proportion (%), odds ratio (OR), 95% confidence interval (CI), and p-value for maintenance or improvement of life satisfaction at 6 months and 1 year followup between control group and intervention group.
Table 6. Proportions of persons engaged in activities at 6 months and 1-year post intervention and corresponding ORs.