
Figures & data
Figure 1. The intervention development process. Attendance varied between 5–8 members in the research circles.
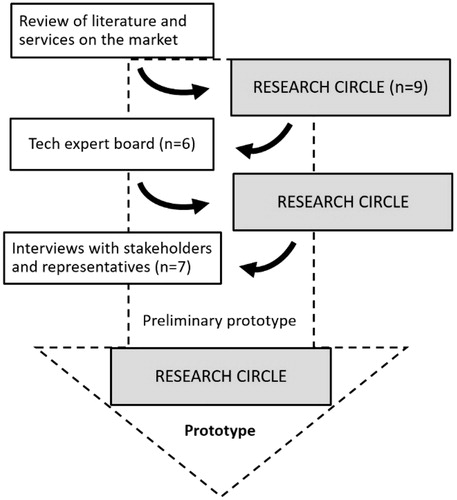
Table 1. Background characteristics of the older adults participating in the research circle (n = 9).
Table 2. TIDieR (Template for intervention description and replication) checklist.
Data availability
The data supporting the findings can be accessed by contacting the first author.