
Figures & data
Figure 1. Structure of the TRANSITION programme and measures used in the feasibility study. QOLI: Quality of Life Inventory; GAS: Goal Attainment Scaling.
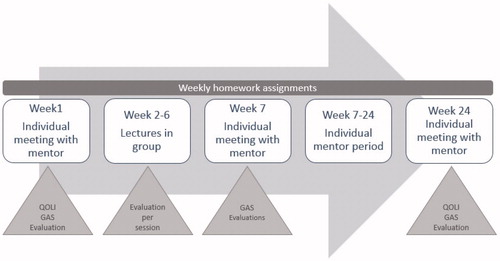
Table 1. Outline of the TRANSITION-programme.
Table 2. Baseline characteristics of the participants in each of the three TRANSITION groups and the total sample.
Figure 2. The goal attainment scale level attained by the completers in their most and second most favourable domain.
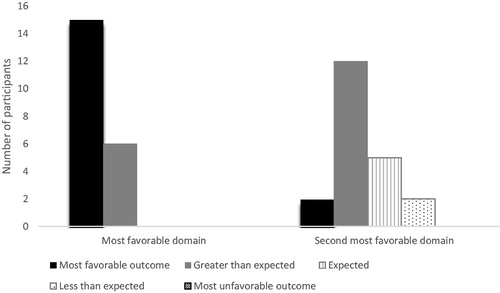
Table 3. Participants’ identified goals within each life domain, and the score level attained.
Supplemental material