
Figures & data
Figure 1. CONSORT 2010 Flow Diagram showing the process and number of participants in each step of the recruitment process and assessments.
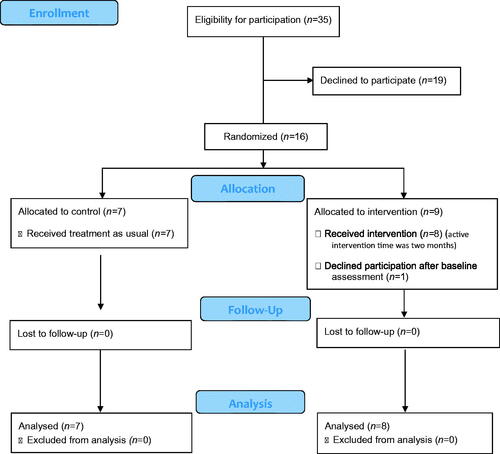
Table 1. Overview of data collection.
Table 2. Participant characteristics at baseline N = 15.
Table 3. Description of participants’ use of digital technology and calendar use before and during the study N = 15.
Table 4. Self-assessed perception of occupational performance and satisfaction performance with The Canadian Occupational Performance Measure (COPM).
Table 5. Self-assessed independence with the Functional Independence Measure (FIM), subscale, a-m and subscale n-r and self-assessed health-related quality of life with the EQ-5D-VAS at each time point.
Table 6. Self-assessed perceived psychosocial impact of the support used by the Psychosocial Impact of Assistive Devices Scale (PIADS), subscales: Competence, Adaptability, Self-esteem at 2 months and, 4 months assessment.