
Figures & data
Table 1. Background characteristics of intervention and control group.
Figure 1. Self-efficacy in solving work- and disease related problems, general self-efficacy, and self-perceived work-ability over time. Measurement time: T0 = baseline, T1= post-intervention (at 1 year), T2= two-year follow-up; Scale Scores on outcome measures: A) Self-efficacy in solving work- and disease-related problems questionnaire [Score range 14–70]; B) GSES, General self-efficacy scale [score range 10–50]; C) WAS, Single Work Ability Index – Single item [Score range 1–10]. ^Intervention group significantly differs from control group at T0, p=.04, *Positive trend was found, p=.06, ^^Intervention group significantly differs from control group at T0, p<.001,
![Figure 1. Self-efficacy in solving work- and disease related problems, general self-efficacy, and self-perceived work-ability over time. Measurement time: T0 = baseline, T1= post-intervention (at 1 year), T2= two-year follow-up; Scale Scores on outcome measures: A) Self-efficacy in solving work- and disease-related problems questionnaire [Score range 14–70]; B) GSES, General self-efficacy scale [score range 10–50]; C) WAS, Single Work Ability Index – Single item [Score range 1–10]. ^Intervention group significantly differs from control group at T0, p=.04, *Positive trend was found, p=.06, ^^Intervention group significantly differs from control group at T0, p<.001,](/cms/asset/429fbfd9-59c6-441b-b29c-c18372d2440e/iocc_a_2228019_f0001_b.jpg)
Figure 2. Paid and unpaid employment status over time. Measurement time: T0 = baseline, T1= post-intervention (at 1 year), T2= two-year follow-up. ^Intervention group significantly differs from control group at T0, p<.001.
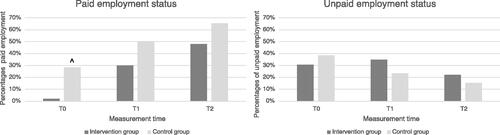
Table 2. Outcome measures for intervention and control groups.
Table 3. Longitudinal generalised equation results for between-group analyses in outcome measure, uncorrected and corrected for gender, onset of the chronic condition, severe physical limitations, and special education.