Figures & data
Figure 1. U/S image of ONSD measurement. It shows the U/S measurement of op in centimeters. The caliper “A” measures the depth at which the ONSD must be measured (3 mm). “B” measures the ONSD (7.2 mm) at this depth.
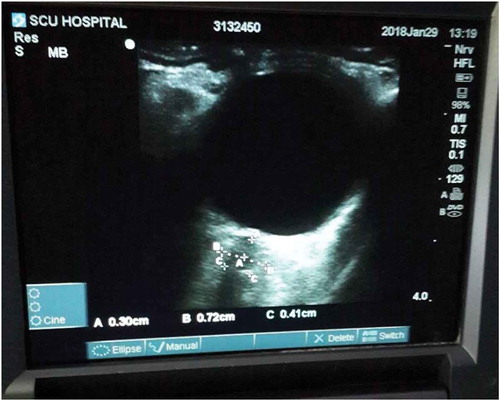
Table 1. Demographic characteristics of the study patients and intraoperative data.
Table 2. Comparison between optic nerve sheath sagittal and transverse diameters in both right and left eyes at different time points.
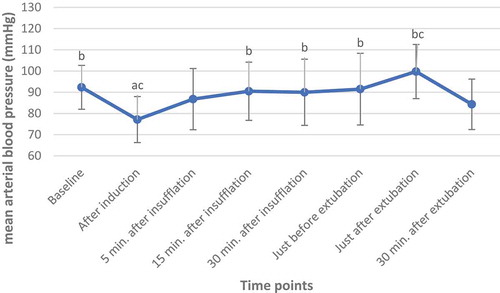
Graph 1. Comparison of mean arterial blood pressure (MAP) at different time points.
aP value for Post Hoc test (LSD) compared to baseline time point bP value for Post Hoc test (LSD) compared to after induction time point cP value for Post Hoc test (LSD) compared to 30 min after insufflation time point
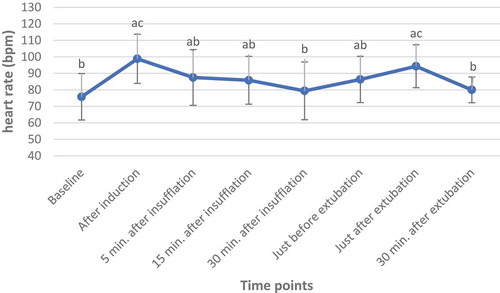
Graph 2. Comparison of Heart rate at different time points.
aP value for Post Hoc test (LSD) compared to baseline time point bP value for Post Hoc test (LSD) compared to after induction time point cP value for Post Hoc test (LSD) compared to 30 min after insufflation time point
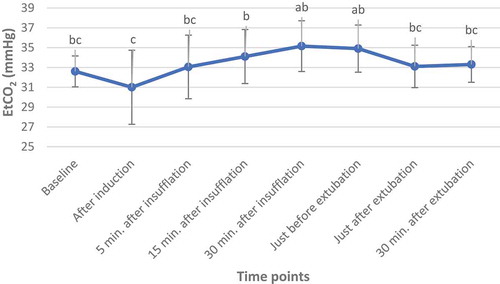
Graph 3. Comparison of end-tidal partial pressure of CO2 (EtCO2) at different time points.
aP value for Post Hoc test (LSD) compared to baseline time point bP value for Post Hoc test (LSD) compared to after induction time point cP value for Post Hoc test (LSD) compared to 30 min after insufflation time point