Figures & data
Table 1. Patients and surgery characteristics. Values are means (SD), median (range) or number.
Table 2. Comparison of the area under the curve (AUC) of peripheral perfusion index (PPI) at different time interval to predict the nitroglycerin dose requirement to reach the target mean arterial blood pressure.
Figure 1. Receiver operating characteristic curve comparing the predictive ability of peripheral perfusion index (PPI) at different time interval to the patients’ response to nitroglycerin-induced hypotension. PPI (T0) = baseline PPI, PPI (T1) = PPI at one minute after induction, PPI (T2) = PPI at one minute after intubation, PPI (T3) = PPI just before initiation of nitroglycerin infusion.
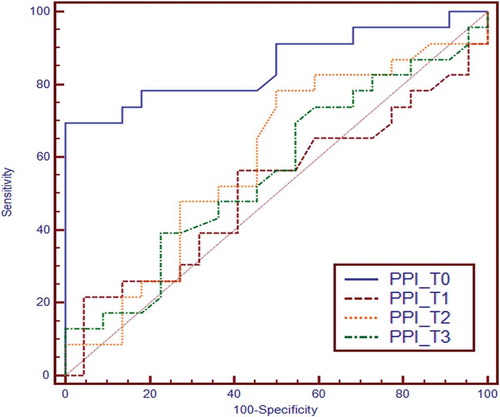
Table 3. Comparison between patient with low and high baseline peripheral perfusion index (PPI). Values are means (SD).
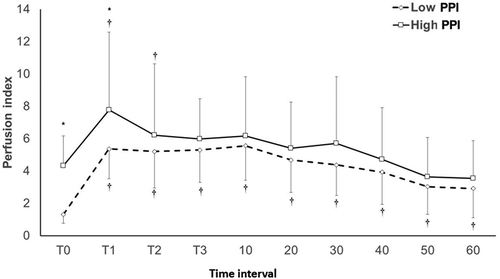
Figure 2. Intraoperative changes of perfusion index. T0; baseline, T1: after induction, T2: before endotracheal intubation, T3: before nitroglycerin infusion, Intraoperative PPI values (10–60 min): Values are means and error bars represent the standard deviation. * Denotes significant difference between the two subgroups. † Denotes significance relative to the baseline value.