
Figures & data
Figure 1. CONSORT flow diagram
Figure 2. Comparison between the procalcitonin level (left) and the QTc (right) between the survivors and the non-survivor group
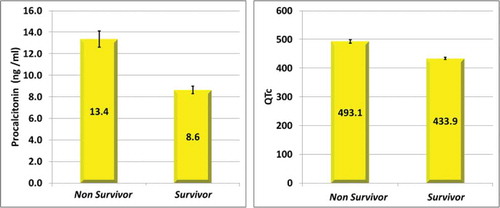
Table 1. Comparison according to ICU mortality
Table 2. Correlations of mortality day among died cases
Figure 3. ROC curve for different variables at day-1 in predicting death
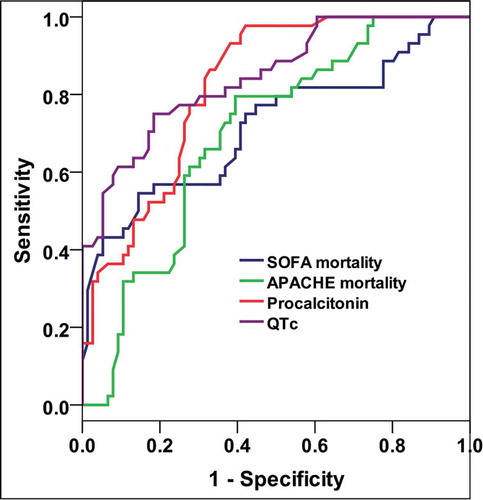
Table 3. Diagnostic performance of different variables at day-1 in predicting death
Table 4. Diagnostic characteristics of suggested cutoff points in predicting death