Figures & data
Figure 1. Study flow chart.
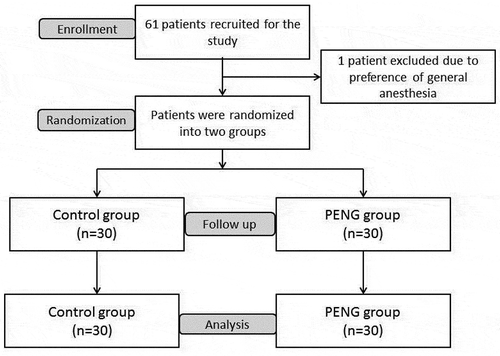
Figure 2. Ultrasound view showing land marks for the PENG block (A) and local anesthetic spread (B).
FA: femoral artery, FN: femoral nerve, IPE: iliopectineal imminence, Ps.M: Psoas muscle and tendon, LA: local anesthetic.
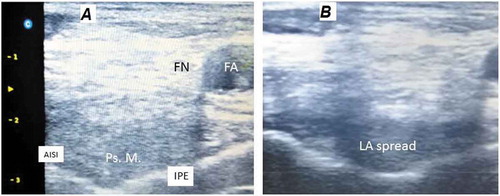
Table 1. Basal characteristics for the included patients in the two study groups. Data are presented as mean±SD, median (interquartile range).
Table 2. Spinal anesthesia trial outcomes in the two groups. Data are presented as mean±SD or n (%).
Figure 3. Pain profile expressed by the patients during positioning for spinal anesthesia.
*P-value is significant if less than 0.05
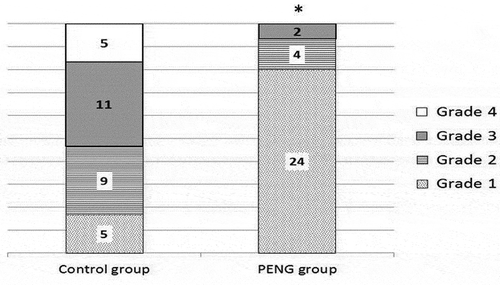
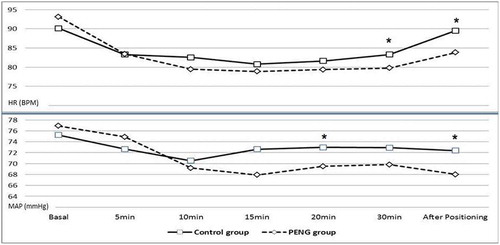
Figure 4. Hemodynamic parameters (HR, MAP) for the study groups before at admission to OR and at 5, 10, 15, 20, and 30 minutes after the block and immediately after positioning for spinal anesthesia.
*P-value is significant if less than 0.05