
Figures & data
Figure 1. A flowchart of the study population
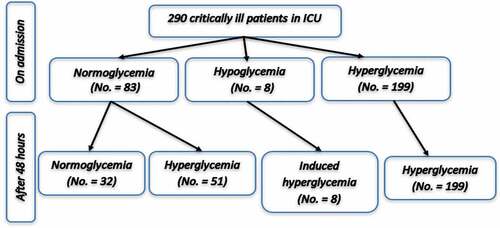
Table 1. Distribution of known diabetic and non-diabetic patients involved in the study according to the glucose level on admission and the peak glucose level at 48 h of admission
Table 2. Kruskal–Wallis test and Wilcoxon rank-sum test for comparison between different groups of glucose intolerance on admission with age, APACHE II score and days of mechanical ventilation and ICU stay
Table 3. Kruskal–Wallis test and Wilcoxon rank-sum test for comparison between different groups of glucose intolerance on peak glucose level during 48 h of admission with age, APACHE II score, days of mechanical ventilation, days of ICU stay, days on steroid, and days on circulatory support
Table 4. Distribution of patients involved in the study according to the peak of glucose level at 48 h of admission concerning the type of feeding
Table 5. The relation between the patients’ mortality and the glucose level on admission and the peak of glucose level at 48 h of admission