1,735
Views
1
CrossRef citations to date
0
Altmetric
Article

COMPARATIVE STUDY BETWEEN THE EFFECT OF VOLUME-CONTROLLED VENTILATION AND PRESSURE CONTROLLED VENTILATION VOLUME GUARANTEED ON GAS EXCHANGE AND RESPIRATORY DYNAMICS DURING ONE-LUNG VENTILATION

ORCID Icon, , &
Pages 248-255 | Received 21 Apr 2021, Accepted 28 Apr 2021, Published online: 18 May 2021

Figures & data

Table 1. Demographic data

Table 2. Oxygenation parameters and haemodynamic data in both groups. Data are expressed as mean ± SD.Time points: before induction of anaesthesia as a baseline (T0); during two lung ventilation (T1); 30 min after one lung ventilation (T2); one hour after OLV (T3); 20 min after resuming TLV (T4); 6; 12; and 24 hours after surgery (T5, T6, and T7). PCV-VG, pressure-controlled ventilation volume guaranteed; VCV, volume-controlled ventilation; PaO2, arterial blood oxygen tension; PaCO2, arterial blood carbon dioxide tension; FiO2, fraction of inspired oxygen; SaO2, arterial oxygen saturation; HR, heart rate; MAP, mean arterial pressure; CVP, central venous pressure. $ P < 0.05 within the PCV-VG group; # P < 0.05 within the VCV group

Figure 1. Flow chart of patients

Figure 1. Flow chart of patients

Figure 2. Comparison between the two studied groups

Figure 2. Comparison between the two studied groups

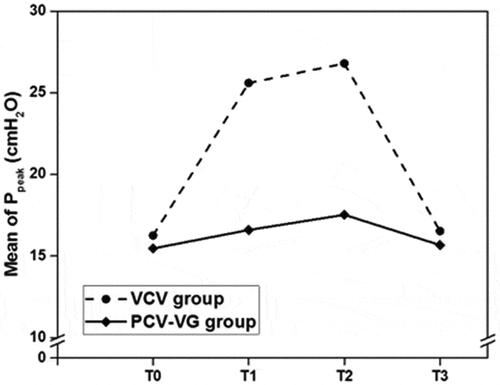
Figure 3. Comparison between the two studied groups according to according to Ppeak(cm/H2O) according to Pmean(cm/H2O)
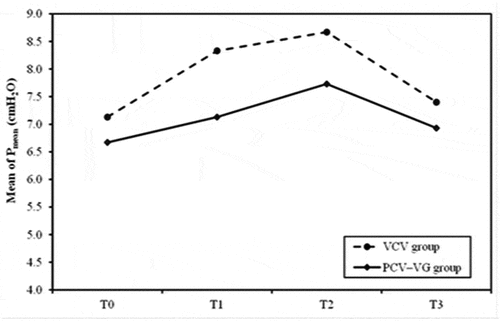
Figure 3. Comparison between the two studied groups according to according to Ppeak(cm/H2O) according to Pmean(cm/H2O)
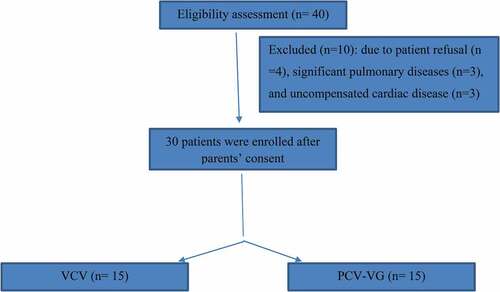
Figure 4. Comparison between the two studied groups

Figure 4. Comparison between the two studied groups

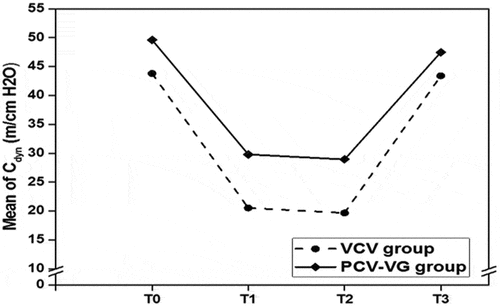
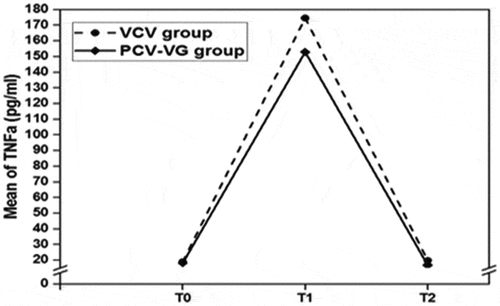
Figure 5. Comparison between the two studied according to Cdyn (ml/cm H2O) groups according to TNFα (pg/ml)

Figure 5. Comparison between the two studied according to Cdyn (ml/cm H2O) groups according to TNFα (pg/ml)

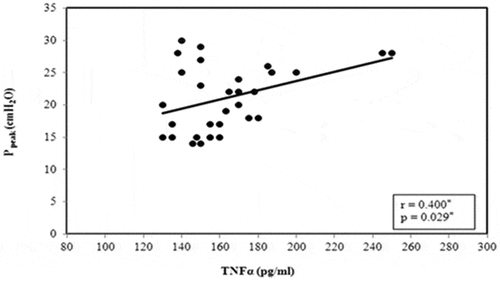
Figure 6. Correlation between TNFα (pg/ml) and P peak (cm/H2O)

Figure 6. Correlation between TNFα (pg/ml) and P peak (cm/H2O)

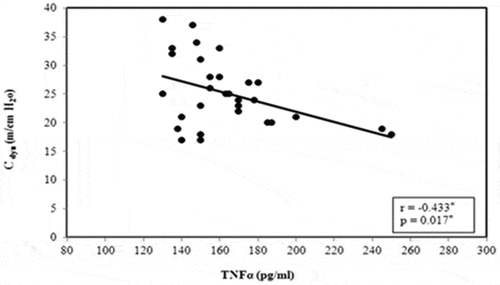
Figure 7. Correlation between TNFα (pg/ml) and Cdyn (ml/cmH2o)

Figure 7. Correlation between TNFα (pg/ml) and Cdyn (ml/cmH2o)