
Figures & data
Flow chart of patients
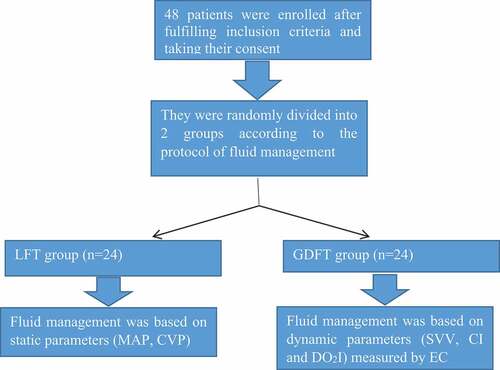
Figure 1. SVV and DO2I-based protocol. SVVx: the threshold value for crystalloid bolus administration after turning patient to prone position (equals SVV measured at prone position + 20%). [Citation30]
![Figure 1. SVV and DO2I-based protocol. SVVx: the threshold value for crystalloid bolus administration after turning patient to prone position (equals SVV measured at prone position + 20%). [Citation30]](/cms/asset/16d9662f-88bd-4ee9-a3eb-50c1e1568b8f/teja_a_1927418_f0001_b.gif)
Figure 2. ROC curve for CI (before and after administration of the first fluid bolus to predict associated increase in CI ≥15% (n = 19) in group II
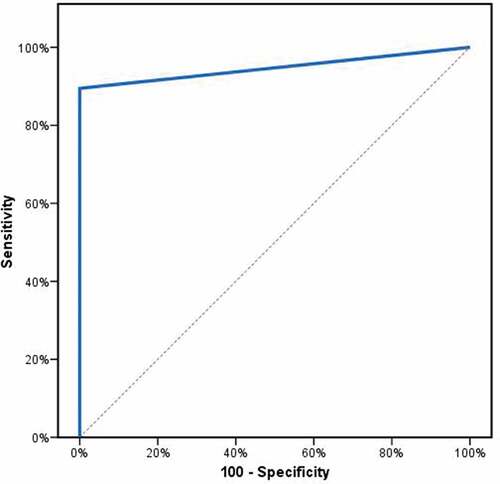
Table 1. Demographic data, duration of the operation, ASA status, and number of instrumental levels
Table 2. Correlation between SVV and CI in group II
Table 3. Comparison between the two studied groups according to total blood loss (ml), intraoperative and postoperative units of packed RBCs and FFP transfused