Figures & data
Figure 1. Study design
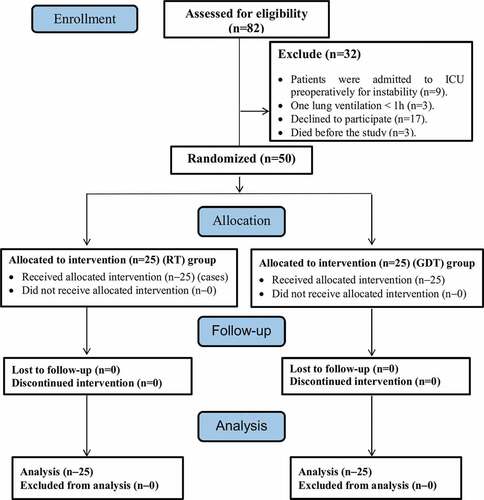
Figure 2. Fluid flow chart of the intraoperative period in both groups
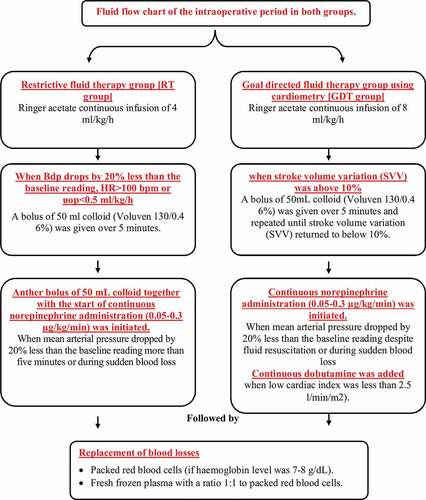
Table 1. Intraoperative and postoperative urine output (ml/h)
Figure 3. Comparison between the two studied groups according to serum lactate (mmol/l)
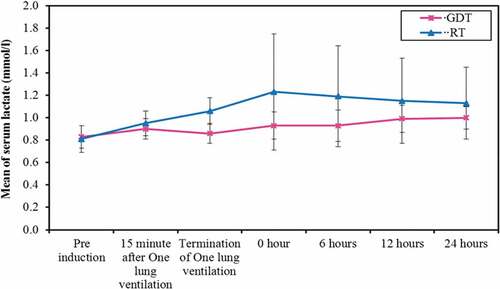
Figure 4. Comparison between the two studied groups according to postoperative serum creatinine (mg/dL)
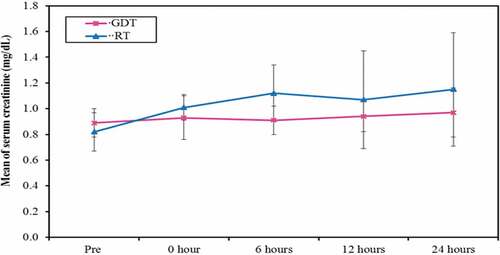
Figure 5. Comparison between the two studied groups according to bicarbonate level in arterial blood gases (mEq/L)
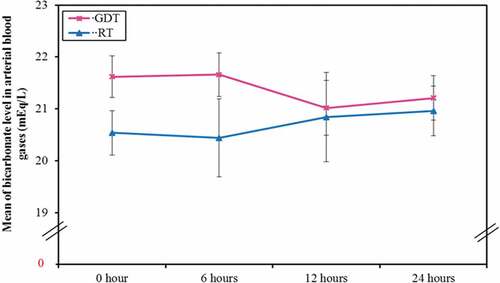
Figure 6. Comparison between the two studied groups according to central venous oxygen saturation (ScVO2) (%)
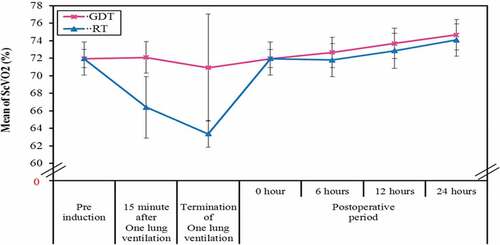
Table 2. Intraoperative blood loss, fluids and blood products transfused in both groups
Figure 7. Comparison between the thoracic fluid content (TFC) (k.ohm−1) in the goal-directed therapy group (GDT) at different times of one lung ventilation
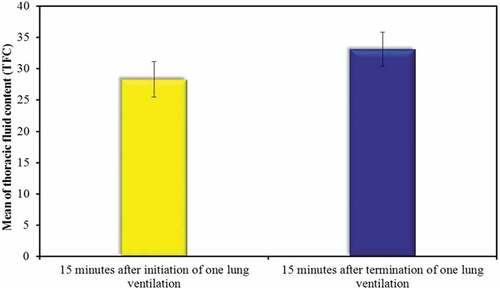
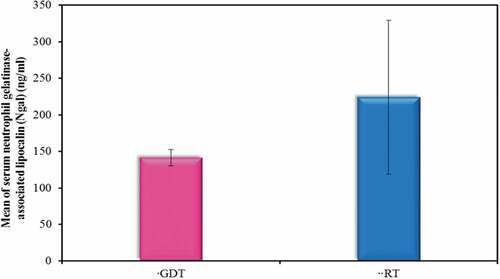
Figure 8. Comparison between the two studied groups according to Serum Neutrophil gelatinase-associated lipocalin (Ngal) (ng/ml)