
Figures & data
Figure 1. Participant flow chart.
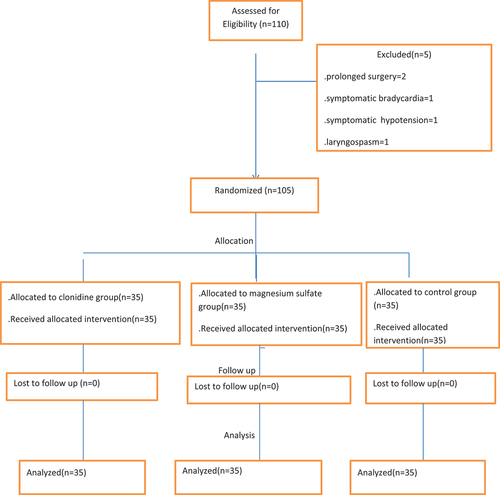
Table 1. Demographic characteristics of the three studied groups(Mean ± SD)
Figure 2. Heart rate changes in the studied three groups.
P0, P15, P30 = before pneumoperitoneum and 15, 30 minutes after pneumoperitoneum.Group C = Clonidine group, Group M = Magnesium sulfate group,Group S = Placebo(saline)group.Values are in mean ± SD.Bpm = beat per minute.
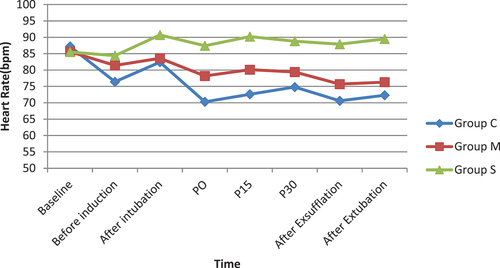
Figure 3. Mean arterial blood pressure (MBP) changes in the studied three groups.
P0, P15, P30 = before pneumo-peritoneum and 15, 30 minutes after pneumo-peritoneum.Group C = Clonidine group, Group M = Magnesium sulfate group, Group S = Placebo(saline)group.Values are in mean ± SD.MBP = Mean blood pressure.
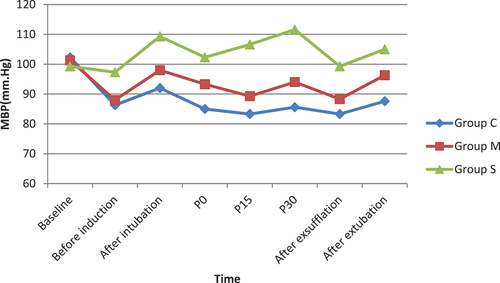
Table 2. Plasma cortisol (ug /dl) level during different time intervals in the studied three groups
Table 3. Intra- operative conditions and recovery characteristics in the studied three groups
Table 4. Postoperative adverse events in the studied three groups
Table 5. Post-operative analgesic consumption in the three studied groups