
Figures & data
Figure 1. Flow chart of the included subjects.
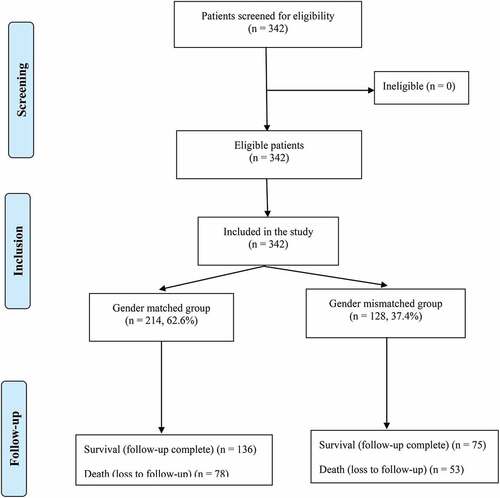
Table 1. Baseline demographic characteristics of the recipients and donors
Table 2. Clinical and operative characteristics of the gender matched and mismatched groups
Table 3. Outcomes of the gender matched and mismatched groups
Figure 2. Kaplan-Meier survival analysis curves for graft rejection according to the recipient-donor gender matching.
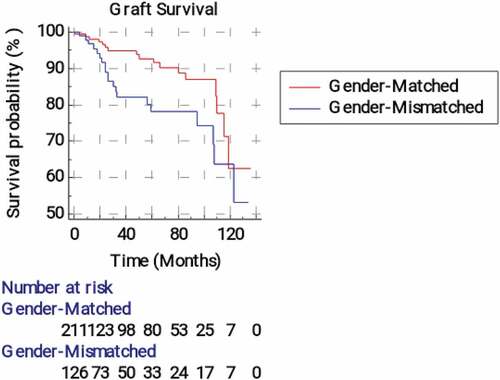
Figure 3. Kaplan-Meier survival analysis curves for surgical graft failure according to the recipient-donor gender matching.
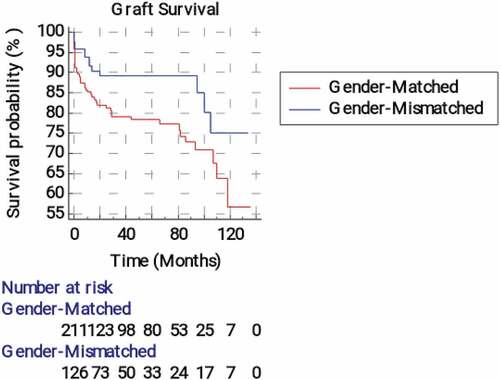
Table 4. Medical and surgical graft survival analysis according to the recipient-donor gender matching
Figure 4. Kaplan-Meier survival analysis curves for medical graft failure according to the four recipient-donor gender matches.
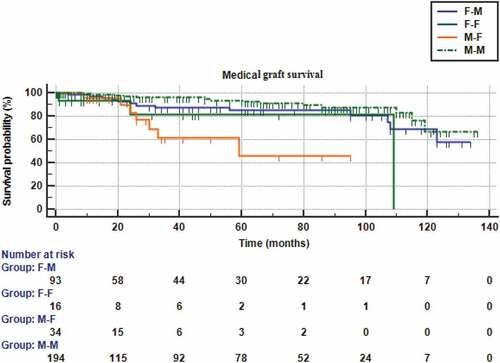
Figure 5. Kaplan-Meier survival analysis curves for surgical graft failure according to the four recipient-donor gender matches.
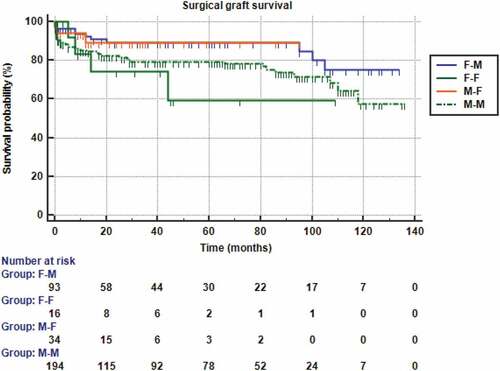
Table 5. Medical and surgical graft survival analysis according to the four subgroups of recipient-donor gender matches
Figure 6. Kaplan-Meier survival analysis for overall patients’ survival according to the recipient-donor gender matching.
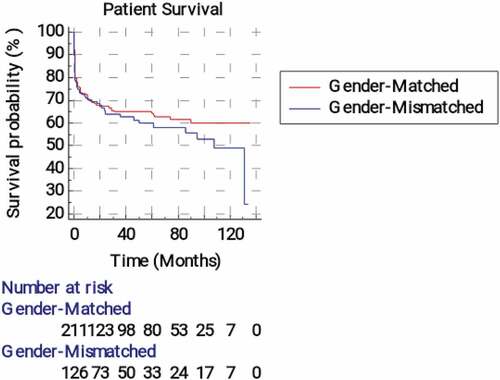
Figure 7. Kaplan-Meier survival analysis for overall patients’ survival according to the four recipient-donor gender matches.
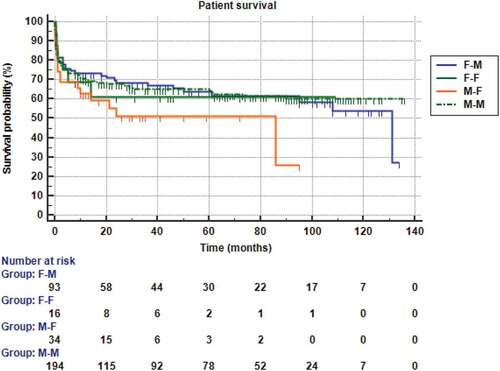
Table 6. Kaplan-Meier recipient survival analysis according to the recipient-donor gender matching
Table 7. Kaplan-Meierrecipient survival analysis according to the four subgroups of recipient-donor gender matches