Figures & data
Figure 1. CONSORT flowchart of the enrolled patients.
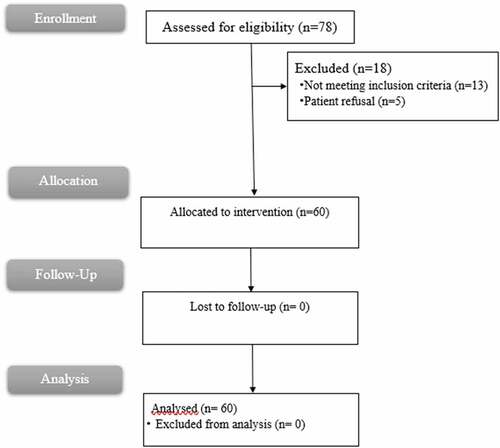
Table 1. Characteristics of the study population.
Table 2. Comparison between noninvasive Hb (SpHb) and laboratory hemoglobin (Invasive Hb).
Figure 2. Correlation between baseline noninvasive Hb (SpHb) and Laboratory hemoglobin (Invasive Hb).
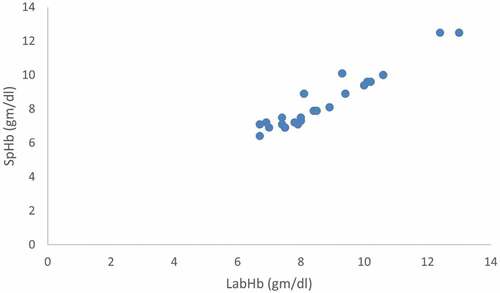
Figure 3. Correlation between pretransfusion noninvasive Hb (SpHb) and Laboratory hemoglobin (Invasive Hb).
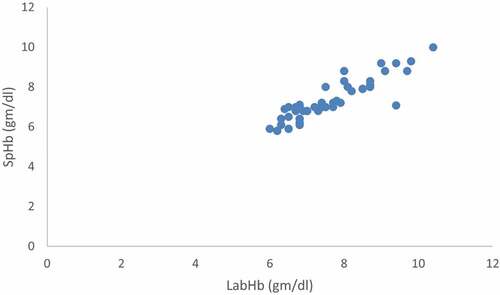
Figure 4. Correlation between posttransfusion SpHb and Invasive Hb.
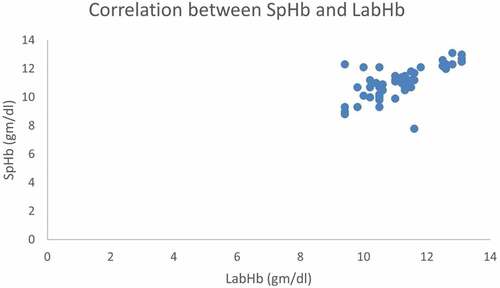
Figure 5. Bland–Altman analysis between baseline noninvasive Hb (SpHb) and Laboratory hemoglobin (Invasive Hb).
Figure 6. Bland–Altman analysis between pretransfusion noninvasive Hb (SpHb) and Laboratory hemoglobin (Invasive Hb).
Figure 7. Bland–Altman analysis between posttransfusion noninvasive Hb (SpHb) and Laboratory hemoglobin (Invasive Hb).