
Figures & data
Figure 1. M-mode and 2D-mode ultrasonographic images of diaphragmatic function.
A, B: Diaphragmatic excursions (D) Ein 2D, and M-ModesC, D: Diaphragmatic thickness (DT), and thickening fraction in 2D -Mode
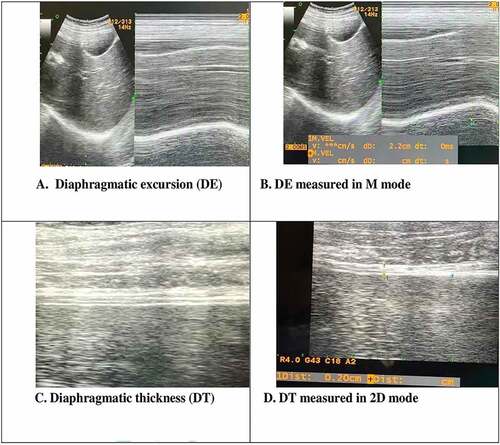
Table 1. Clinical and demographic variables of the patients.
Figure 2. Serum L-carnitine levels in patients with RF after high or low-dose L-carnitine supplementation.
A. Serum L-carnitine levels in both groups at 0, 3, and 7 days. B. Changes in serum L-carnitine levels from day 0 to day 7 in the two groups. The significance of differences in L-carnitine levels between the two groups at each time point was determined by one-way ANOVA and Tukey’s test. A p-value < 0.05 was considered statistically significant.
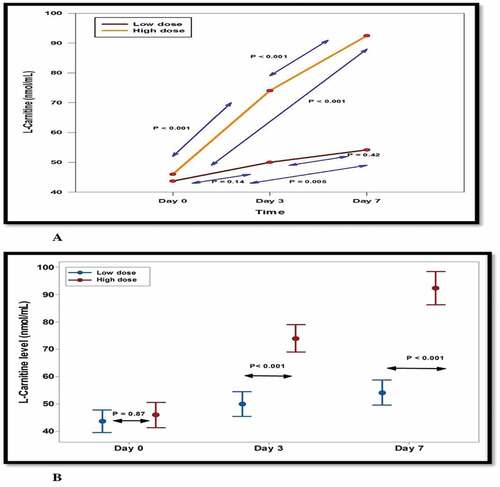
Figure 3. Changes in diaphragmatic function parameters.
A: Differences between diaphragmatic excursion (DE) in each group at days 0, 3, and 7. B: Each group changes in DE from day 0 to day 7. C: Differences in diaphragmatic thickening fraction (DTF) in each group from days 0,3, and 7. D: Changes in DTf from days 0,3, and 7 in each group. Significance was determined by one-way ANOVA with Tukey’s post-hoc test. Significance was determined by independent t-tests. A p-value < 0.05 was considered statistically significant.
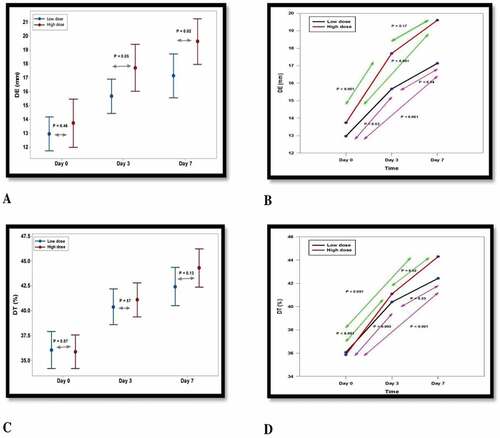
Figure 4. Correlations between serum L-carnitine levels and diaphragmatic parameters.
A. Correlations between L-carnitine and diaphragmatic excursion (DE). B. Correlations between Lcarnitine and diaphragmatic thickening fraction (DTf). The sign before “r” denotes the direction of the relationship. Correlations between L-carnitine and the two diaphragmatic parameters were identified using Pearson’s correlation coefficient
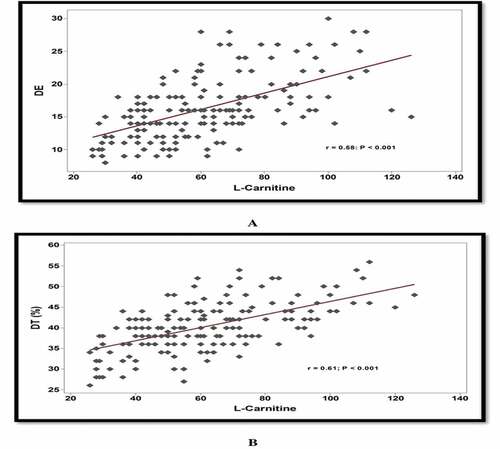
Table 2. Effects of L-carnitine on parameters of the diaphragmatic function.