
Figures & data
Figure 1. Flowchart of the enrolled patients.
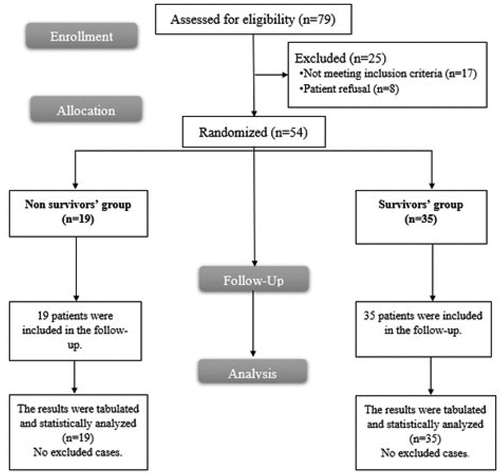
Table 1. Comparison between the two studied groups according to patients’ characteristics and causes of infection of the studied groups.
Table 2. Comparison between the two studied groups according to platelet count, plateletcrit and mean platelet volume.
Figure 2. ROC curve of different parameters to discriminate non-survivor’s from survivors’ groups.
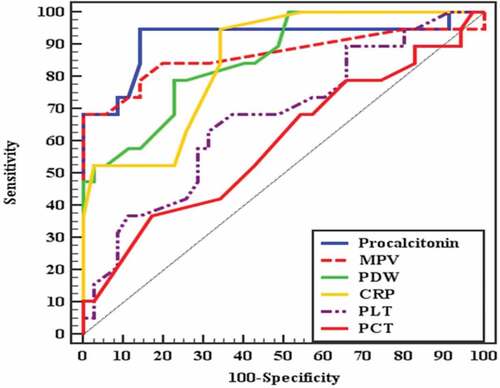
Table 3. Validity (AUC, sensitivity, specificity) for different parameters to predict mortality.
Table 4. Univariate and multivariate logistic regression analysis for the parameters affecting mortality.
Table 5. Correlation between Procalcitonin and SOFA score with different parameters.