
Figures & data
Figure 1. The AUC analysis for the ability to predict severe post-induction hypotension.
AUC: area under receiver operating characteristic curve, IJV: internal jugular vein, IVC: inferior vena cava.
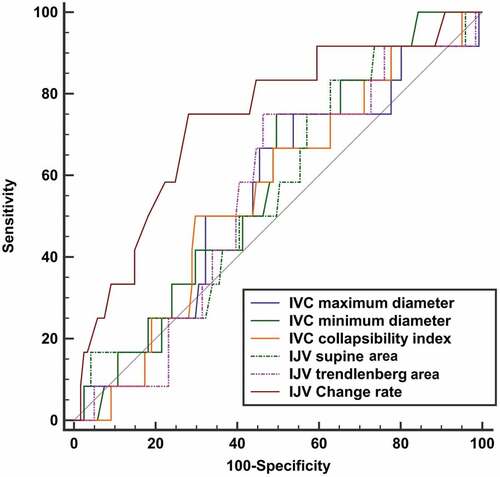
Figure 2. The AUC analysis for the ability to predict prolonged post-induction hypotension.
AUC: area under receiver operating characteristic curve, IJV: internal jugular vein, IVC: inferior vena cava.
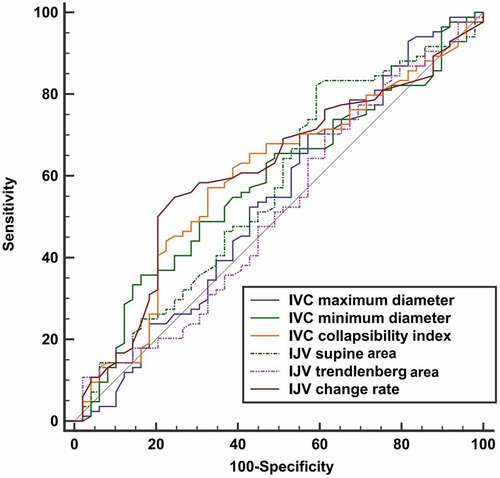
Table 1. Demographic data and hemodynamic characteristics. Presenting data as median (quartiles) and frequency (percentage).
Table 2. Demographic data and hemodynamic characteristics in hypotensive and non-hypotensive patients. Presenting data as median (quartiles) and frequency (percentage).
Table 3. Accuracy of IVC and IJV parameters in predicting severe post-induction hypotension.
Table 4. Accuracy of IVC and IJV parameters in predicting prolonged post-induction hypotension.