
Figures & data
Figure 1. CONSORT flow diagram. Enrolment, randomization and allocation of the study subjects.
Table 1. Demographic and operative data.
Figure 2. Comparison between the two studied groups according to haemodynamic parameters (a) heart rate, (b) mean arterial pressure and (c) cardiac index. Results are presented as mean ± SD.
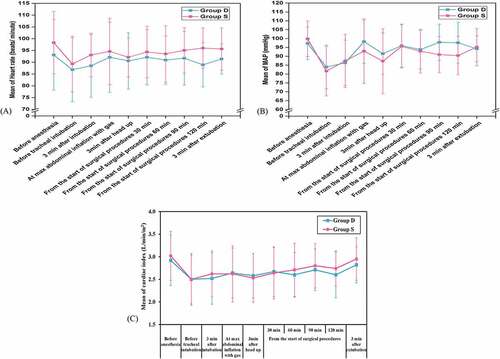
Figure 3. Comparison between the two studied groups according to MACEN.
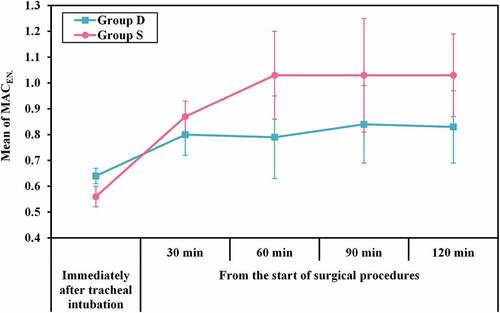
Table 2. Comparison between the two studied groups according to immediate, intermediate recovery, length of PACU stay.