
Figures & data
Figure 1. Consort flow chart.
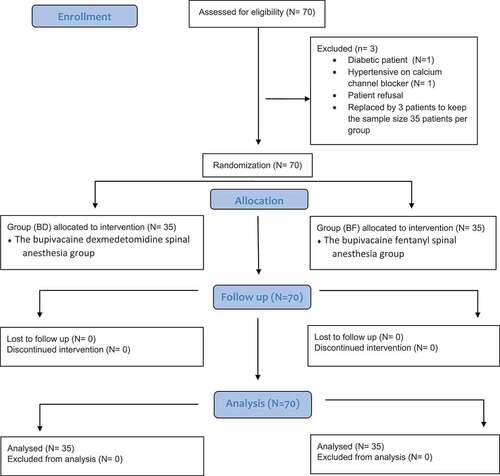
Table 1. Demographic data of patients in both groups.
Figure 2. Incidence of POUR in both groups at the 3rd post-operative hour.
Data are presented as percentage of patients. Bupivacaine-Dexmedetomidine group, BF: Bupivacaine-Fentanyl group, POUR: Post-operative urinary retention.
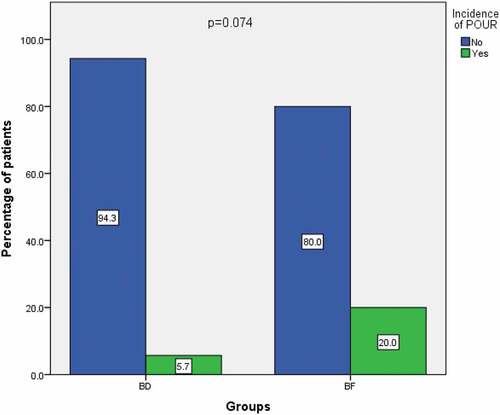
Table 2. Intra-operative fluids, and post-operative micturition characteristics in both groups.
Table 3. Sensory and motor block durations in both groups.
Table 4. Variables in the equation for the binomial logistic regression.