
Figures & data
Figure 1. Flow chart of the study.
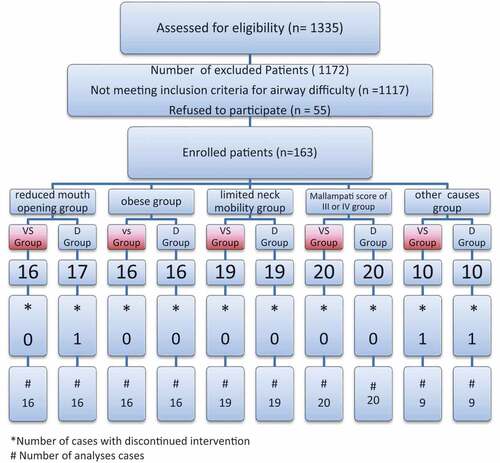
Table 1. Characteristics of the participants in both groups.
Table 2. Intubation conditions in both groups.
Figure 2. Intubation time in each difficulty cause in both studied groups.
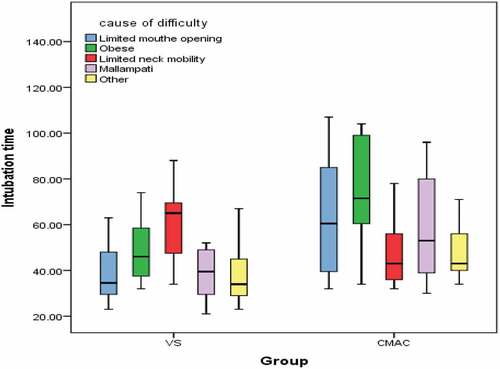
Table 3. Intubation time in both groups in different causes of difficult airway.
Figure 3. Oxygen saturation in both groups.
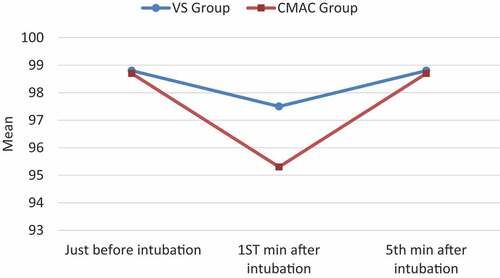
Table 4. Multiple regression analysis of different risk factors in relation to intubation time.
Figure 4. Heart rate changes in both groups.
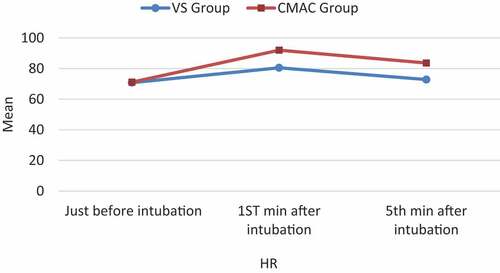
Figure 5. Mean Arterial Blood Pressure (MABP) changes in both groups.
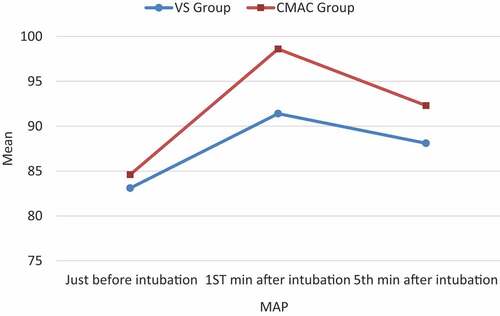
Table 5. Complications assessment in both groups.