Figures & data
Table 1. Demographic data.
Table 2. Comparison of groups in terms of surgery duration and ischemia time.
Table 3. Comparison of AST and ALT levels between groups.
Table 4. Comparison between groups as regards serum albumin, total and direct bilirubin, PT, and INR.
Figure 1. Line graph between groups as regards MAP. Data are presented as mean ± SD, A = TIVA group, B = desflurane group, MAP = mean arterial pressure.
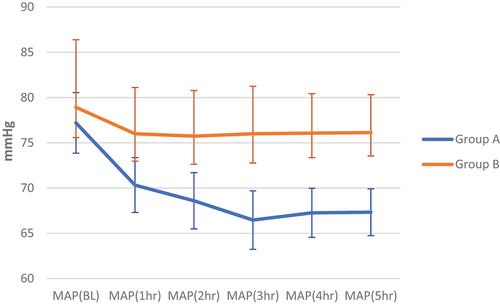
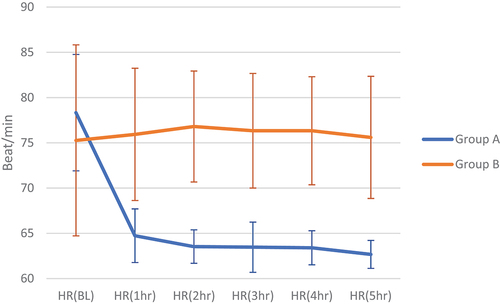
Figure 2. Line graph between groups as regards HR. Data expressed as mean ± SD, A = TIVA group, B = desflurane group, HR = heart rate.