Figures & data
Table 1. Comparison between the two studied groups according to demographic data, comorbidities, mean oxygen saturation on day 1, the needs for mechanical ventilation, mortality, length of hospital stay and ICU stay.
Table 2. Comparison between the two studied groups according to plasma level of Syndecan-1, Heparan sulfate, D-dimer, Interleukin-6, Procalcitonin and CRP.
Figure 1. The comparison between changes in the SDC-1, H.S, CRP, D-dimer, IL-6 and procalcitonin between the two groups.
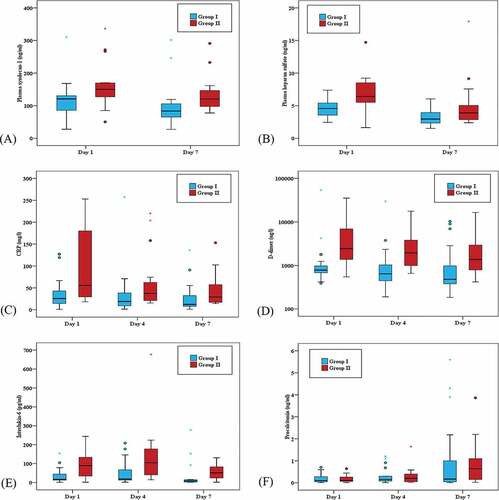
Table 3. Relation between mortality and different parameters (syndecans-1, heparan sulfate, D-dimer, Interleukin-6, CRP and APACHE II score).
Figure 2. The correlation between syndecan-1 and other parameters. It showed a positive correlation with CRP, D-dimer, IL-6, APACHE score and length of hospital stay. SDC-1 was negatively correlated with oxygen saturation.
Figure 3. The correlation between heparan sulfate and other parameters. H.S was positively correlated with D-dimer, IL-6, CRP and length of ICU stay. Also H.S was negatively correlated with oxygen saturation.