
Figures & data
Figure 1. Consort flow chart.
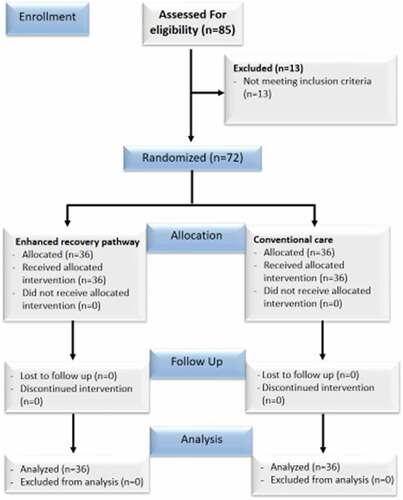
Figure 2. Comparison of QOR 40 total score between the two studied groups. Values are presented as mean ±SD. *significant differences between groups P < 0.05.
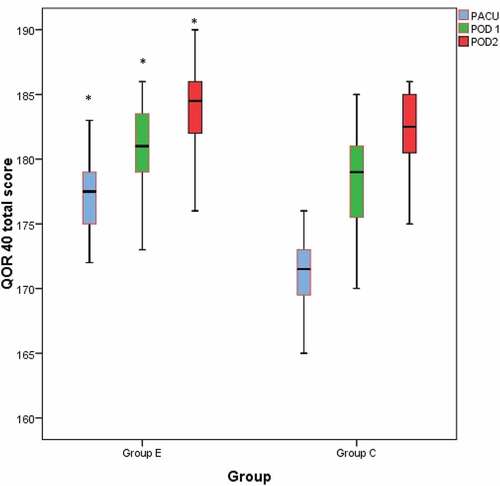
Figure 3. Comparison of random blood sugar (mg/dL) between the two studied groups. Values are presented as mean ±SD. *significant differences between groups P < 0.05.
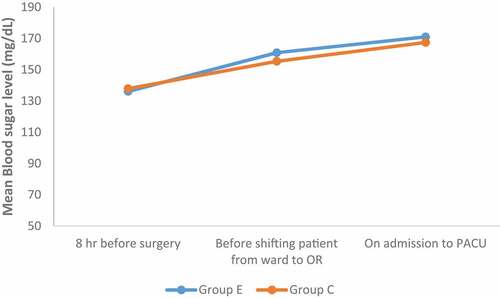
Figure 4. Comparison of visual analogue score (VAS) between the two studied groups. Values are presented as mean ±SD. *significant differences between groups P < 0.05.
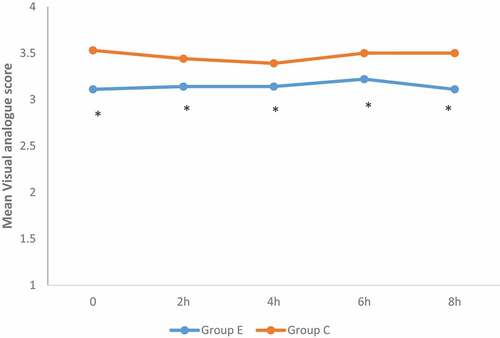
Table 1. Demographic characteristics.
Table 2. Perioperative data.
Table 3. Comparison of C-reactive protein (mg-dl-1) and interleukin-6 (pg.Ml-1) between the two studied groups.