
Figures & data
Figure 1. Line graph describes mean changes that occurred in PI, MABP, and SBP starting from baseline to 60 minutes of cesarean section.
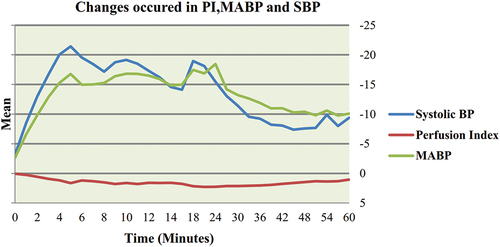
Figure 2. Correlation between change in PI and change in systolic blood pressure during spinal anesthesia for cesarean delivery.
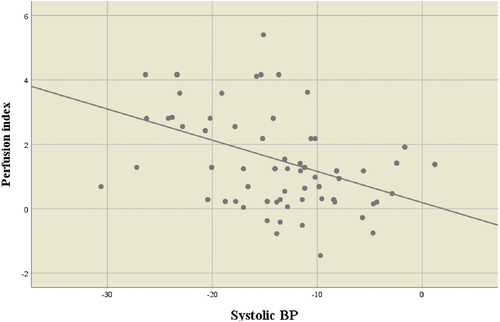
Table 1. Correlations between changes that occurred in the systolic blood pressure and in perfusion index.
Table 2. Univariate linear regression analysis to predict the effect of PI on SBP.
Figure 3. Diagnostic ability of PI in prediction of hypotension during cesarean section.
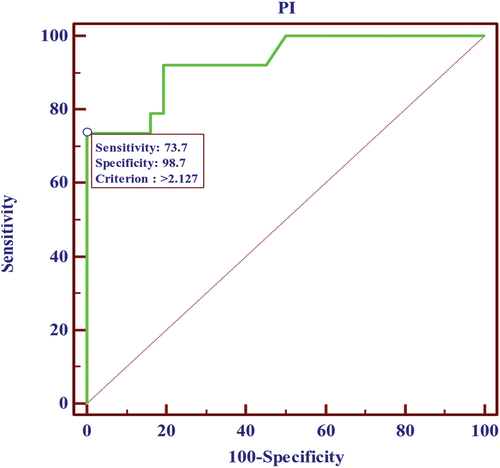
Table 3. Diagnostic ability of PI in prediction of hypotension during cesarean section.
Table 4. Relations between the blood pressure variables and perfusion index following oxytocin bolus.
Figure 4. Relations between perfusion indexes before ephedrine bolus vs. after ephedrine bolus.
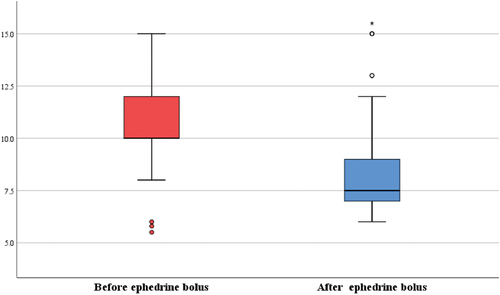
Table 5. Relations between perfusion indexes before ephedrine bolus vs after ephedrine bolus.