
Figures & data
Table 1. Patients’ characteristics of the two study groups: Systemic anticoagulation (therapeutic), group-1 and non-systemic anticoagulation (prophylactic), group-2 anticoagulation dose.
Table 2. Patients’ characteristics of the both failed and patent arterial lines.
Figure 1. The cumulative incidence of index arterial line failure in the systemic anticoagulation (therapeutic), group-1 and non-systemic anticoagulation (prophylactic), group-2 anticoagulation dose, (log-rank test statistic 6.95, P = 0.008).
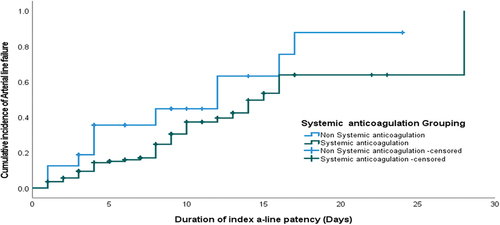
Figure 2. The median duration of index a-line patency in the systemic anticoagulation (therapeutic), group-1 and non-systemic anticoagulation (prophylactic), group-2 anticoagulation dose, with Kaplan–Meier survival estimated, (log-rank P=0.008).
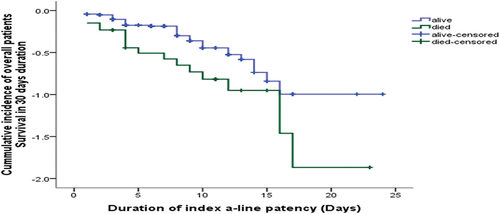
Table 3. Potential predictors of index arterial line failure: Univariate Cox-proportional hazard regression method.
Table 4. Potential predictors of index arterial line failure: multivariate Cox-proportional hazard regression method.
Table 5. Deaths within the first 45 days after arterial line insertion and its cause according to systemic anticoagulation (therapeutic) and non-systemic anticoagulation (prophylactic).
Table 6. Deaths within the first 45 days after arterial line insertion and its reasons according to the failure of arterial line.