
Figures & data
Table 1. Demographic data, ASA status, types, duration of surgery, fluid balance, hemodynamics, HR, and mean blood pressure at different times of followup of the studied group.
Figure 1. (A) Receiver operator characteristic curve demonstrating the sensitivity and the specificity of ICON and ED, (B) Bland Altman analysis of ICONCO and EDCO of CO results.
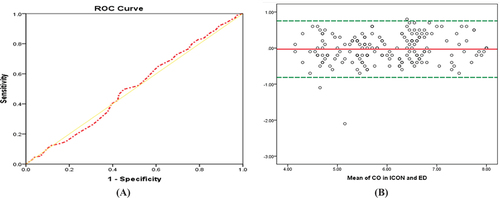
Table 2. Cardiac output (l/min) by the two methods at different time of follow-up.
Table 3. CI (l/min/m2), SV (ml/beat), SVI (ml/m2/beat), SVR (mmHg/min/ml), DO2I (ml O2/min/m2) by the two methods among the studied groups at different times of follow-up.
Figure 2. Bland Altman analysis of (A) ICONCI and EDCI of CI results, (B) ICONSV and EDSV of SV results, (C) ICONSVI and EDSVI of SVI results, (D) ICONSVR and EDSVR of SVR results, (E) ICONDO2I and EDDO2I of DO2 results.
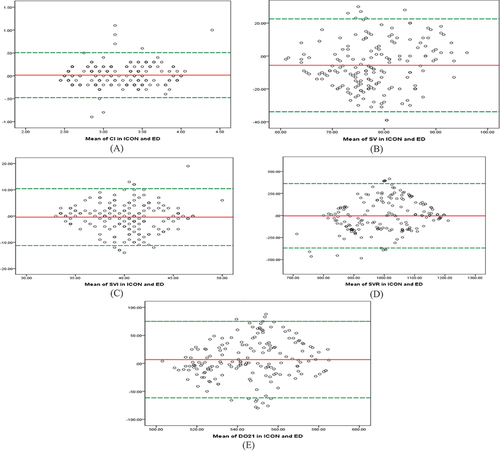
Table 4. The studied parameters in the base line time (T1), T3, T4, and T5 by the two methods.