
Figures & data
Figure 1. The flow diagram of patient progress through the randomized trial.
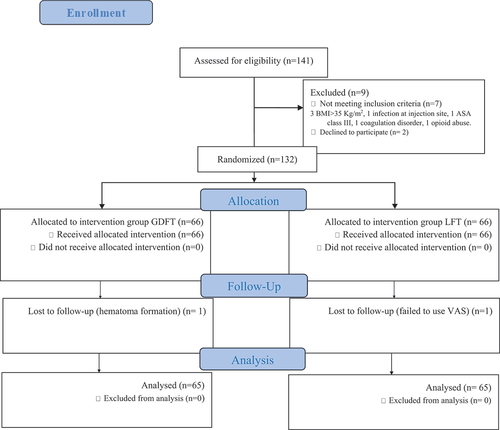
Table 1. Demographic characteristics, type, and duration of surgery for the studied groups.
Table 2. Postoperative VAS score follow-up and analgesic requirements of the studied groups.
Figure 2. Plasma levels of tumor necrosis factor.
T0=1 h before surgery, T1=2 h postoperative, T2=12 h postoperative, T3=24 h postoperative, TNF-α=tumor necrosis factor, B=Bupivacaine group, BC=Bupivacaine Calcitonin group.*=P is significant when <0.05
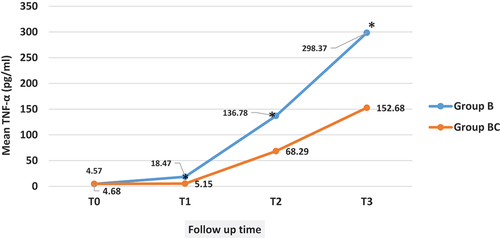
Figure 3. Plasma levels of interleukin −6.
T0=1 h before surgery, T1=2 h postoperative, T2=12 h postoperative, T3=24 h postoperative, IL-6=Interleukin −6, B=Bupivacaine group, BC=Bupivacaine Calcitonin group.*=P is significant when <0.05
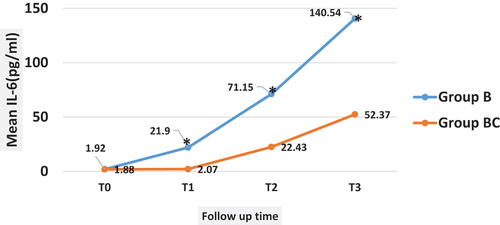
Figure 4. Plasma levels of interleukin −10.
T0=1 h before surgery, T1=2 h postoperative, T2= 12 h postoperative, T3=24 h postoperative, IL-10=Interleukin -6, B = Bupivacaine group, BC = Bupivacaine Calcitonin group.* = P is significant when <0.05
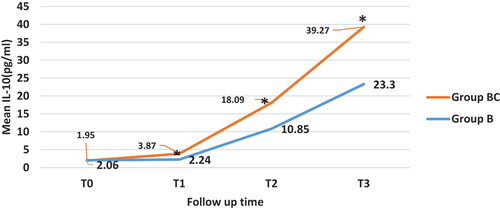
Table 3. Side effect distribution among studied groups.