
Figures & data
Figure 1. Participant flow diagram.
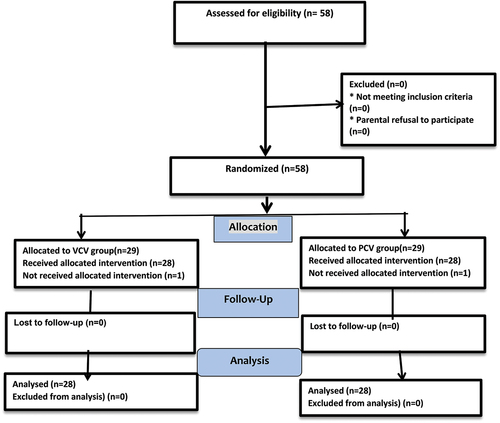
Table 1. Demographic data and operative details.
Figure 2. (a) the oropharyngeal leak pressure (OLP) between groups (Mean±sd), P < 0.05 significant difference. (b) the peak inflation pressure (PIP) between groups (Mean±sd), P < 0.05 significant difference. (c) the oropharyngeal leak pressure and Peak inflation pressure difference (OLP-PIP).
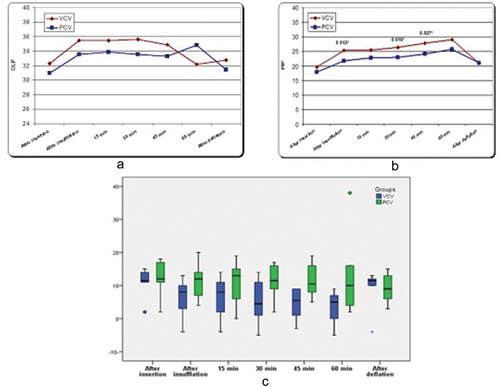
Figure 3. Calculated Leak Fraction (LF) in the two groups (Median and range), P < 0.05 significant difference.
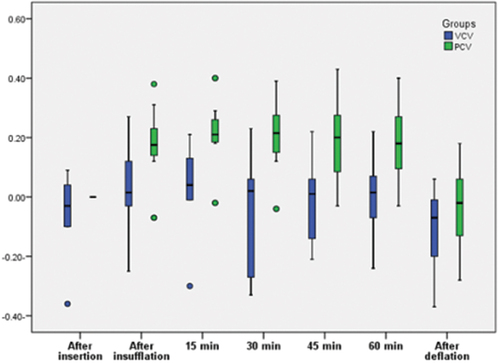
Figure 4. Calculated dynamic compliance (Cdyn) in the two groups (Mean±sd) P < 0.05 significant difference.
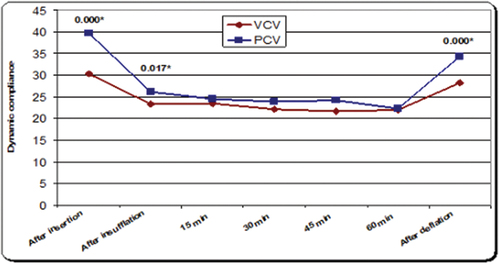
Table 2. Arterial blood gas analysis (ABG) in the two studied groups.
Supplemental material