
Figures & data
Figure 1. Ultrasound view of the transverse thoracic muscle plane.
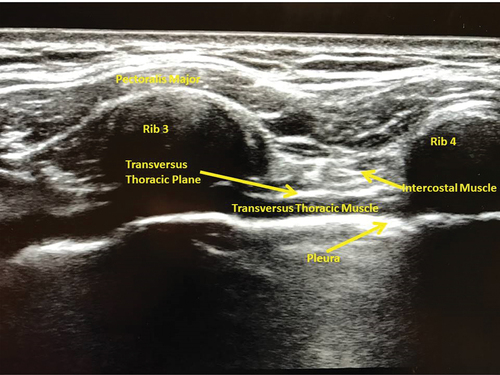
Figure 2. Ultrasound view of the rectus sheath plane.
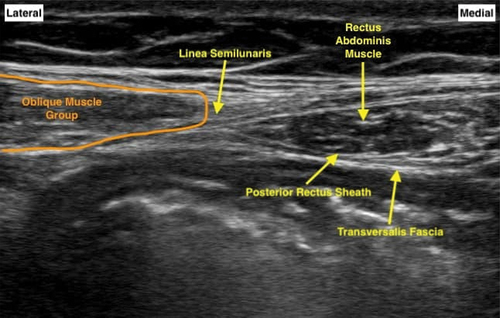
Figure 3. Bar graph between groups as regard intraoperative fentanyl consumption.
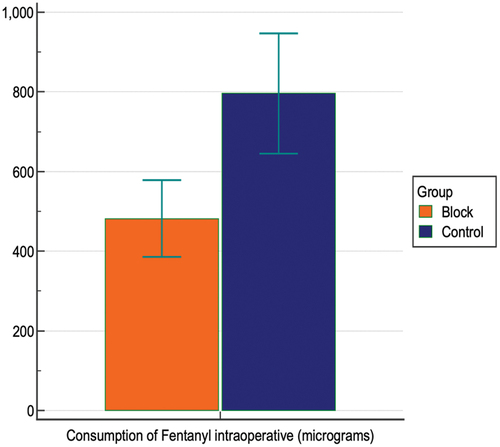
Figure 4. Bar graph between groups as regard postoperative extubation time.
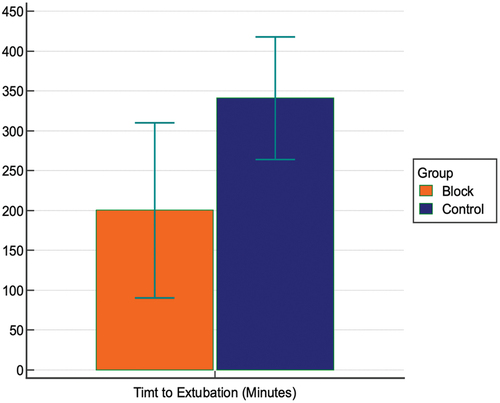
Figure 5. Flow chart of patient randomization.
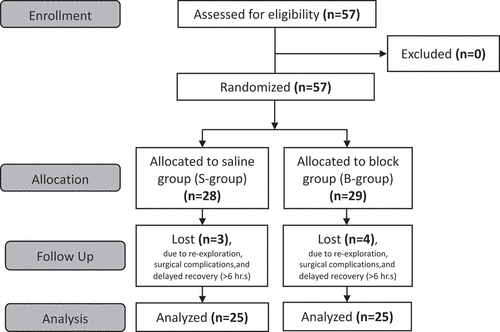
Table 1. Comparison between groups with regard to demographic data.
Table 2. Comparison between groups with regard to hemodynamics data.
Table 3. Comparison between groups with regard to intraoperative narcotic consumption data.
Table 4. Comparison between groups as regards time to extubation.
Table 5. Comparison between groups with regard to postoperative narcotic consumption data.
Table 6. Comparison between groups with regard to postoperative VAS score.