
Figures & data
Figure 1. (a): Identification of insertion point 3 cm lateral to the spinous process of (T5-T6). (b): Ultrasound-guided mid-point transverse process to pleura. The local anesthetic injection was made at the midpoint between the posterior border of the transverse process and the pleura (LA; local anesthetic, N; needle).
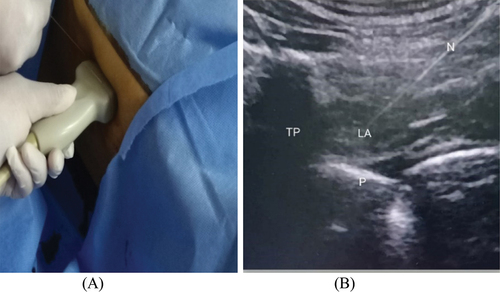
Figure 2. CONSORT flow diagram.

Table 1. Comparison of the two study groups based on demographic information.
Figure 3. Comparison between the two groups regarding resting NRS (A) and during coughing (B).
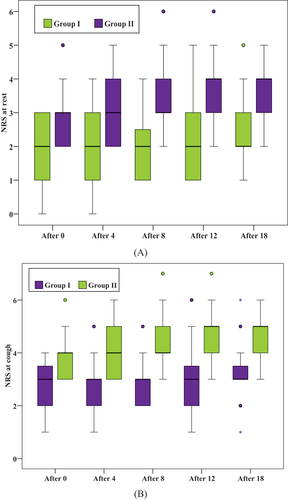
Figure 4. Comparison between the two studied groups according to oxygen saturation (%) (A) and SpO2/FiO2 (B).
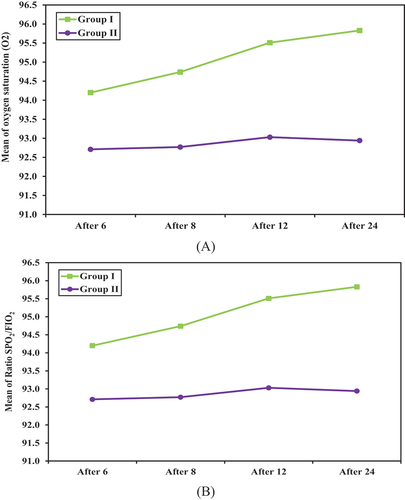
Table 2. Comparison of the two groups concerning the time to first analgesic requirement and total morphine use and chronic pain at 3 months.
Table 3. Comparison of the two groups concerning undesirable side effects in both groups.