
Figures & data
Figure 1. Flow chart of the studied cases.
Table 1. Demographic and operative characteristics of the study groups.
Figure 2. HR, MBP, SV and CO changes during specific times A-HR, B – MBP, C-SV, D-CO.
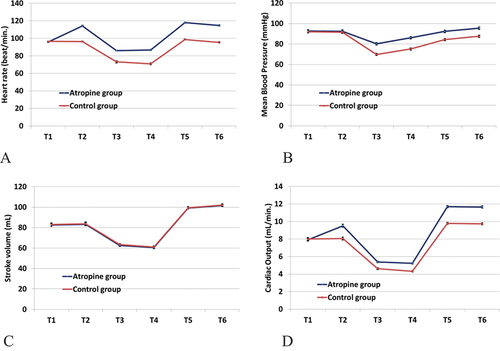
Table 2. Comparison regarding heart rate, mean blood pressure, and total ephedrine consumption.
Table 3. Comparison regarding cardiac output, systemic vascular resistance, and stroke volume.
Table 4. Comparison regarding neonatal APGAR score and umbilical artery ABGs.