
Figures & data
Table 1. Demographic data.
Figure 1. The AUC analysis for the ability of baseline PI to predict early postinduction hypotension.
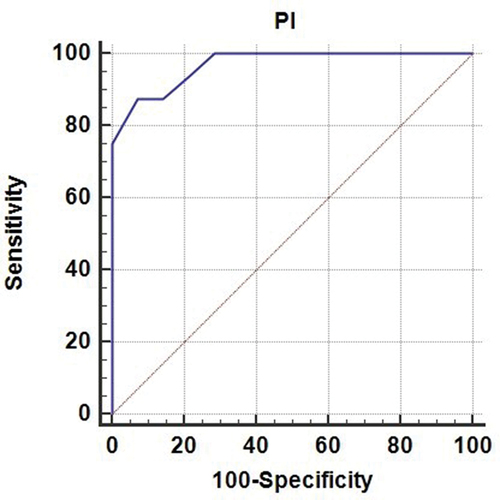
Table 2. The AUC analysis for the ability of baseline PI to predict early and late postinduction hypotension.
Figure 2. Trends of mean SBP and PI in patients with early hypotension (H) and patients without (Hout).
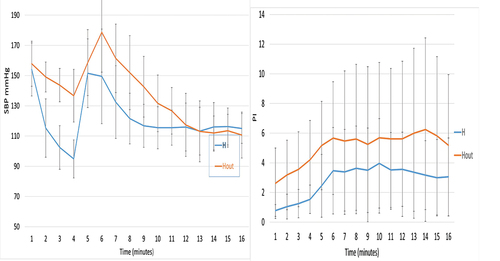
Table 3. Trends of heart rate, systolic blood pressure, diastolic blood pressure, mean arterial blood pressure and perfusion index in patients with early hypotension (H) and patients without early hypotension (Hout).