
Figures & data
Figure 1. Study flow chart.
Table 1. Demographic data, type, and duration of surgery.
Table 2. Comparison of sensory and motor blockade (minutes), time of first rescue of analgesia (hours), total consumption, and numbers of patients’ requests for rescue analgesia between both studied groups.
Figure 2. The mean post-operative VAS score among both studied groups.
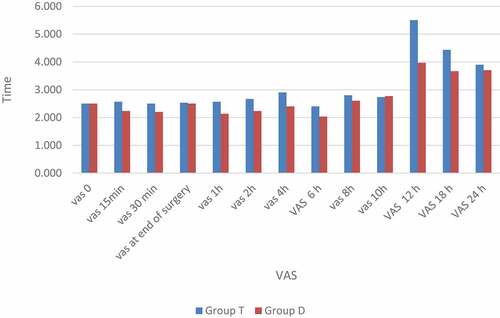
Figure 3. Comparison of postoperative complications between both studied groups.
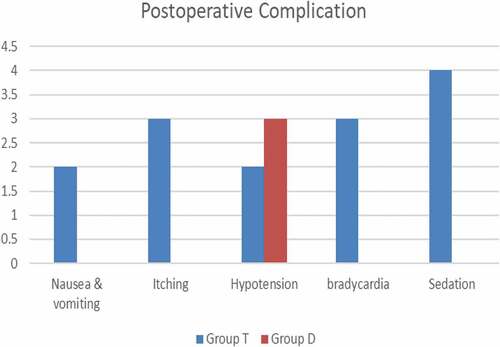
Table 3. Comparison of the LIKERT scale between both studied groups.