
Figures & data
Figure 1. CONSORT flow diagram.
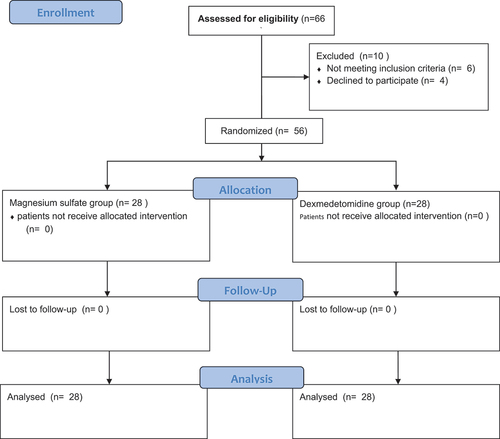
Table 1. Aldrete score [Citation7].
Table 2. Correlation between the two groups in accord with demographic inputs.
Table 3. Correlation between the two groups according to the mean arterial pressure (MAP) (mmHg).
Table 4. Correlation between the two groups as regards the heart rate (beat/min).
Table 5. Correlation between groups regarding bleeding score.
Table 6. Assessment of postoperative pain by VAS score.
Figure 2. Correlation between groups 1 and 2 as regards surgeon satisfaction.
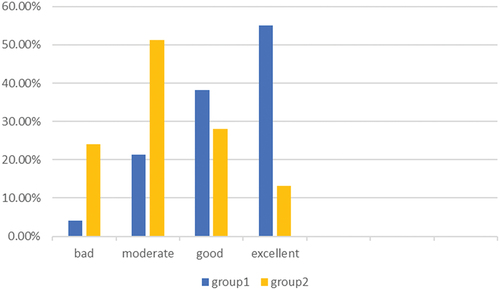
Table 7. Correlation between groups as regards the Ramsay sedation score.