
Figures & data
Figure 1. CONSORT flow chart of the participants.
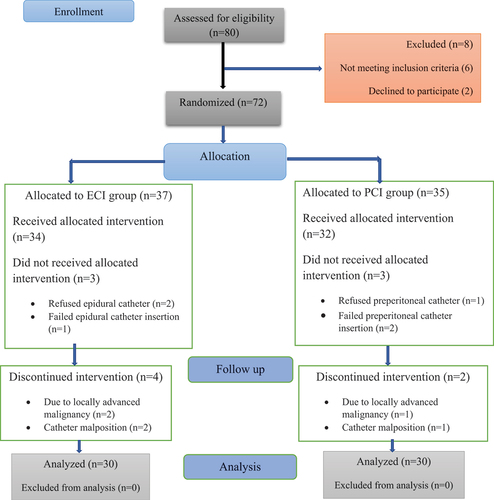
Table 1. Demographic characteristics of two study groups.
Table 2. CVP over study time, Intra-op. fentanyl consumption, first need of analgesia, and 48 h total morphine consumption between the two groups.
Figure 2. Postoperative NRS score over study time between two study groups.
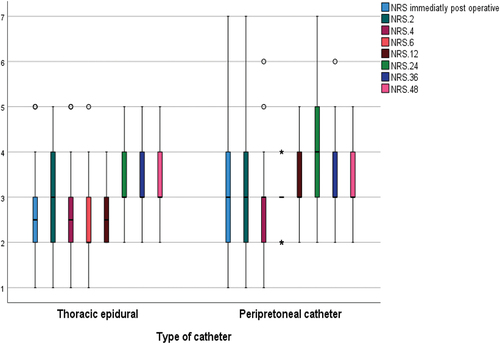
Table 3. Perioperative mean blood pressure over study time between the two study groups.
Table 4. Perioperative heart rate over study time between the two study groups.
Figure 3. Box and whisker plot showing troponin distribution over study time and between two studied groups.
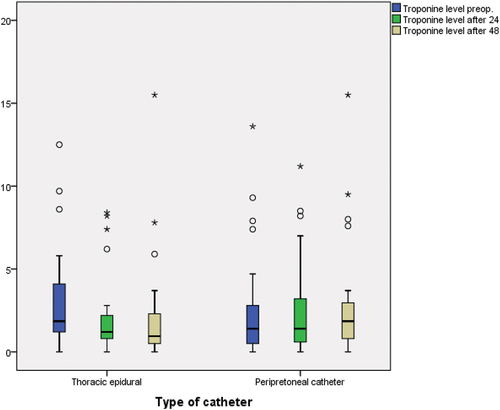
Figure 4. Box and whisker plot showing BNP distribution over study time and between two studied group.
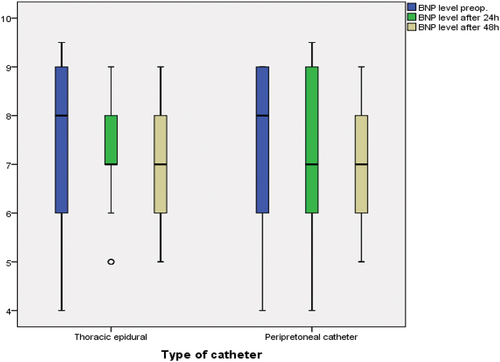
Table 5. Postoperative side effects and cardiovascular complications between the two study groups.