Figures & data
Table 1. Clinical characteristics of the study population. Data are presented as mean (standard deviation) or number (percentage).
Figure 1. ROC curves for different hemodynamic variables as predictors of cardiovascular collapse.
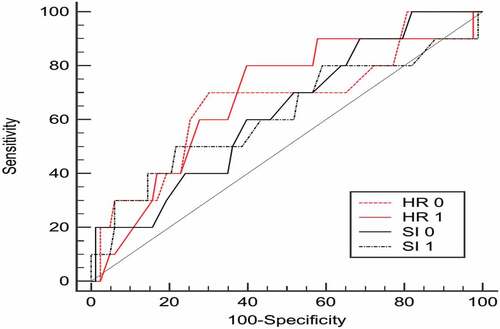
Table 2. Hemodynamic variables as predictors of cardiovascular collapse.
Figure 2. Shock index in patients with and without postoperative cardiovascular collapse. Data are presented as columns (mean) and error bars (standard deviation). CV = cardiovascular, *p < 0.05 and **p < 0.01. T 0 pre-induction, T 1 post-LIMA harvest and T 2 after weaning from cardiopulmonary bypass.
Figure 3. Shock index in patients with and without postoperative AKI. Data are presented as columns (mean) and error bars (standard deviation). AKI = acute kidney injury, *p < 0.05 and **p < 0.01.
Table 3. Hemodynamic parameters and their sensitivity and specificity to predict postoperative acute kidney injury.
Figure 4. Shock index in patients with and without postoperative prolonged mechanical ventilation >48 h. Data are presented as columns (mean) and error bars (standard deviation). *p < 0.05 and **p < 0.01.
Figure 5. ROC curves for different variables as predictors of prolonged postoperative ventilation >48 h.
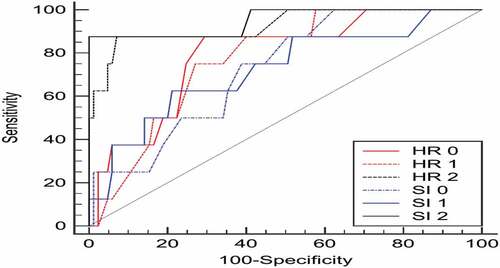
Figure 6. Shock index in cases of postoperative in-hospital mortality and in cases where there was no postoperative in-hospital mortality. Data are presented as columns (mean) and error bars (standard deviation). *p < 0.05 and **p < 0.01.
Figure 7. Shock index in patients with and without postoperative morbidity. Data are presented as columns (mean) and error bars (standard deviation). *p < 0.05 and **p < 0.01.