
Figures & data
Figure 1. concort flow chart of the study groups.
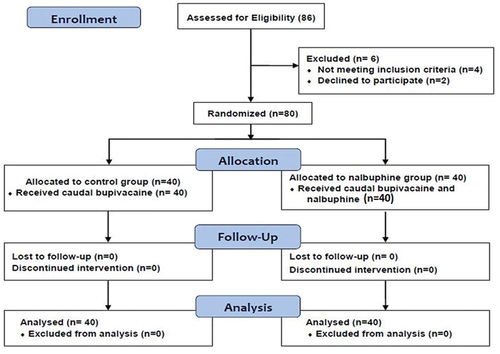
Table 1. Demographic and clinical data of the studied groups.
Table 2. Postoperative PAED agitation scale comparisons between groups.
Table 3. Comparison of postoperative RASS score between study groups.
Table 4. Comparison of postoperative m-CHEOPS score between groups.
Table 5. Distribution of study groups according to postoperative outcomes.