
Figures & data
Figure 1. The flow diagram of patient progress through the randomized trial.
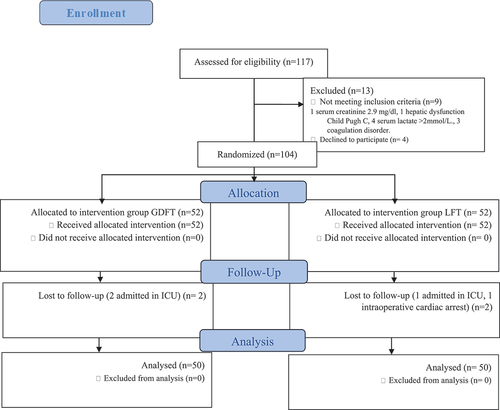
Figure 2. Serum lactate during follow up among studied groups.
GDFT=Goal directed fluid therapy group, LFT= Liberal fluid therapy group
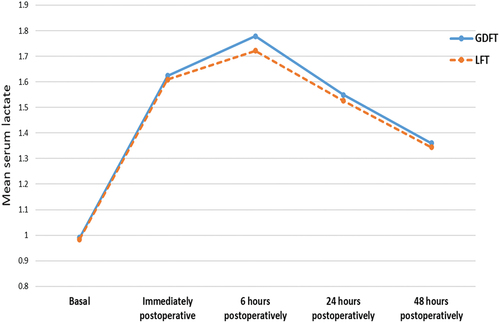
Figure 3. Serum creatinine during follow up among studied groups.
GDFT=Goal directed fluid therapy group, LFT= Liberal fluid therapy group
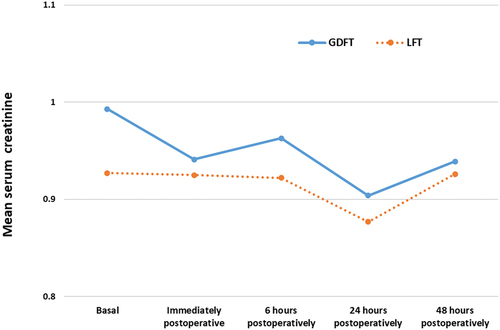
Table 1. Demographic data, type of surgery, and operative time comparing the two groups.
Table 2. Clinical parameters.
Table 3. Clinical parameters (continue).
Table 4. Fluid management.
Table 5. Hypotensive episodes and ephedrine.
Table 6. Complication distribution among studied groups.