
Figures & data
Table 1. Basic demographic data, ASA physical status, and block performance data in the two groups.
Table 2. Assessment of hemodynamic changes during the postoperative period in the two groups.
Table 3. Postoperative O2 saturation in the two groups.
Figure 1. Pain score changes in the two study groups.
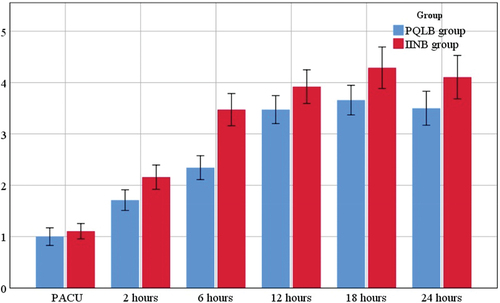
Table 4. Postoperative pain scores in the study groups.
Table 5. Postoperative analgesic profile and opioid-related complications in the study groups.
Table 6. Patient satisfaction in the study groups.