Figures & data
Figure 1. Sonoanatomy of axillary brachial plexus.
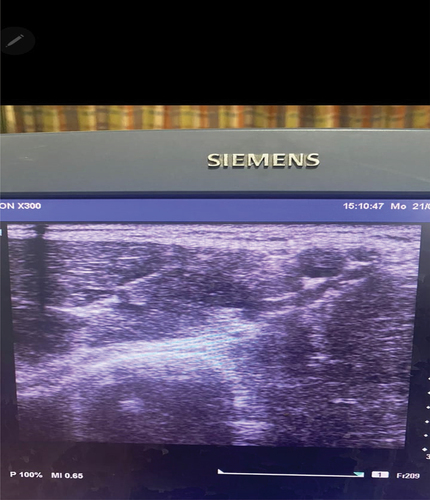
Figure 2. Probe position in the axilla.
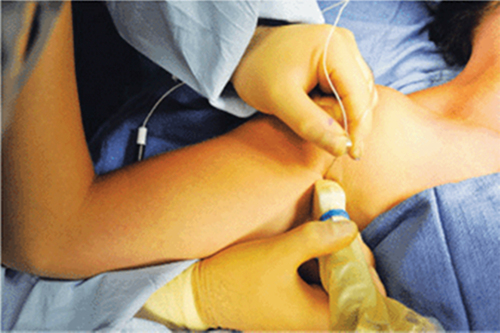
Table 1. FLACC pain scale.
Figure 3. CONSORT flowchart of the studied patients.
Table 2. Patients demographic data in group (A) and group (B) (n = 60).
Table 3. Modified Bromage scale in group (A) and group (B) (n = 60).
Table 4. FLACC score in group (A) and group (B) (n = 60).
Figure 4. Intraoperative heart rate. HR0 = at time of admission to OR, HR1 = after induction, HR2 = after skin incision, HR15 = after 15 min. HR30 = after 30 min from skin incision, HR45 = after 45 minfrom skin incision, HR60 = after 60 min from skin incision.
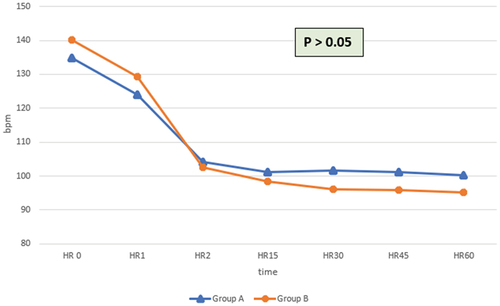
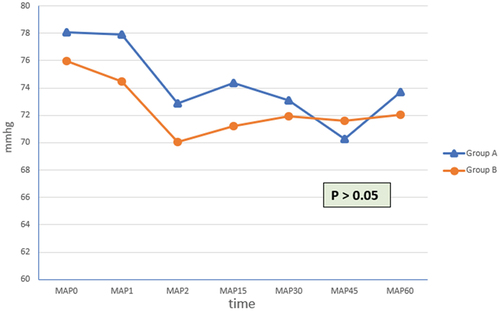
Figure 5. Intraoperative mean arterial blood pressure, MAP. MAP0 = at time of admission to OR, MAP1 = after induction, MAP2 = after skin incision, MAP15 = after 15 min. MAP30 = after 30 minutes from skin incision, MAP45 = after 45 min from skin incision, MAP60 = after 60 min from skin incision.