
Figures & data
Figure 1. Ultrasound picture of ESPB.
Ultrasound guided ESPB, the yellow arrow pointed to the needle tip touching the origin of erector spinae muscle from the T7 transverse process.
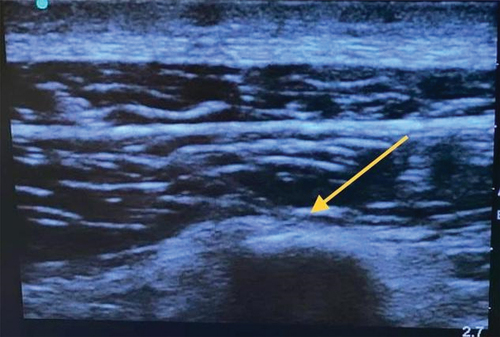
Figure 2. CONSORT flow diagram.
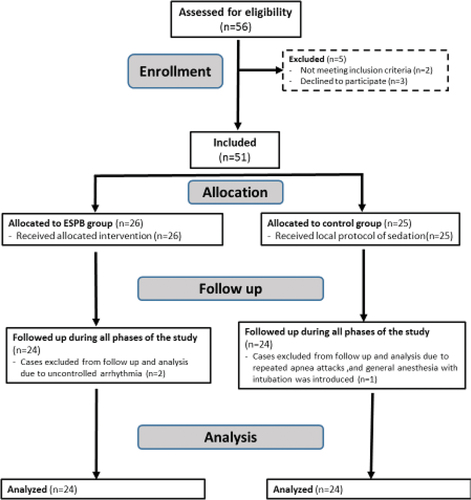
Table 1. Demographic data, Child classification, and procedure duration.
Figure 3. Heart rate changes among the studied cases.
Box and whisker graph of heart rate (beats/min) in the two studied groups, the thick line in the middle of the box represents the median, the box represents the inter-quartile range (from 25th to 75th percentiles), the whiskers represent the minimum and maximum after excluding extremes (asterisks). Number(s) attached indicate(s) patient serial number in the original master table.
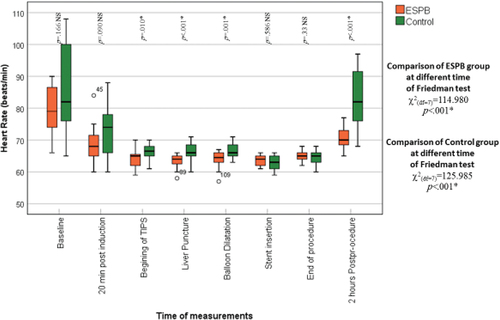
Figure 4. ANI index the among studied cases.
Box and whisker graph of ANI in the two studied groups, the thick line in the middle of the box represents the median, the box represents the inter-quartile range (from 25th to 75th percentiles), the whiskers represents the minimum and maximum after excluding extremes (asterisks). Number(s) attached indicate(s) patient serial number in the original master table
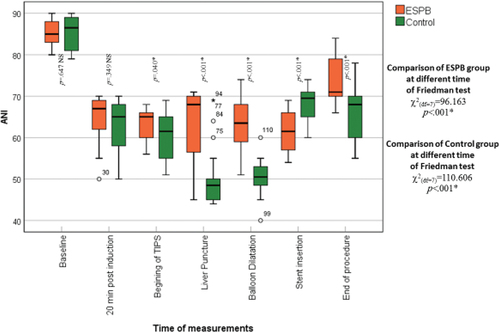
Table 2. Total Fentanyl consumption (μg), and postoperative complications.