
Figures & data
Figure 1. CONSORT flowchart of the enrolled patients.
Table 1. Demographic data, side of the operation and duration of block performance and surgery between groups.
Figure 2. Intraoperative and postoperative (a) heart rate, (b) mean arterial blood pressure, and (c) oxygen saturation measurements of the studied groups.
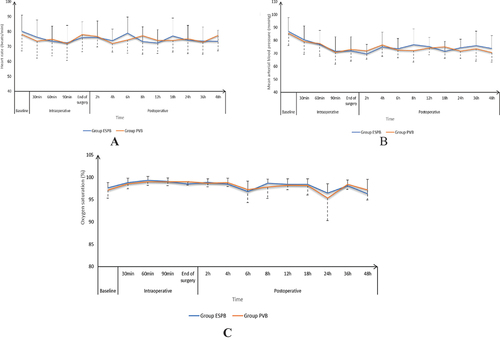
Table 2. VAS measurements at rest and movement of the studied groups.
Table 3. Intraoperative fentanyl and postoperative morphine consumption of the studied groups.
Table 4. Postoperative complications between groups.