
Figures & data
Table 1. Domains of the post-operative quality recovery scale for recovery from NMB [Citation17].
Figure 1. Study flow chart.
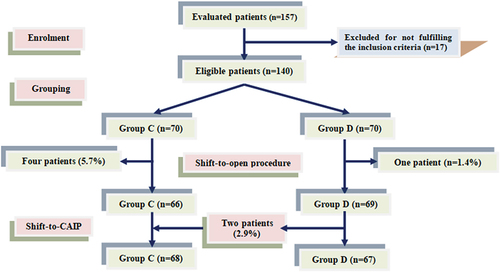
Table 2. Patients’ characteristic and demographic data in both groups.
Figure 2. Percentage of HR & MAP change with abdominal insufflation of patients of both groups.
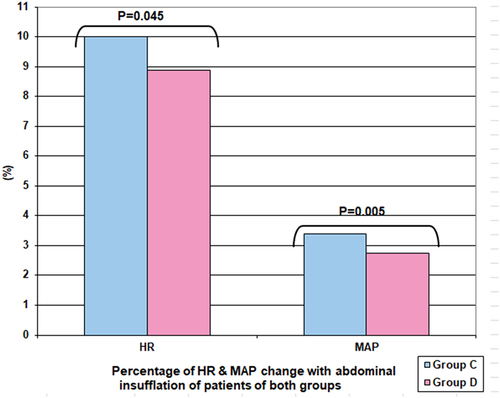
Table 3. Patients’ intraoperative data.
Figure 3. Patient’s distribution according to the percentages of patients returned to normally of PQRS domains at time of hospital discharge.
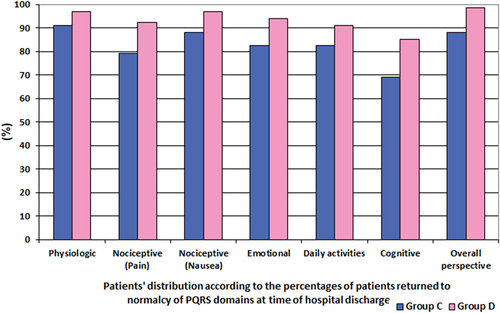
Table 4. Time till recovery of NMB and PQRS scale data.
Figure 4. Surgeon’s distributionn according to their satisfaction by the applied procedure NMB & AIP.
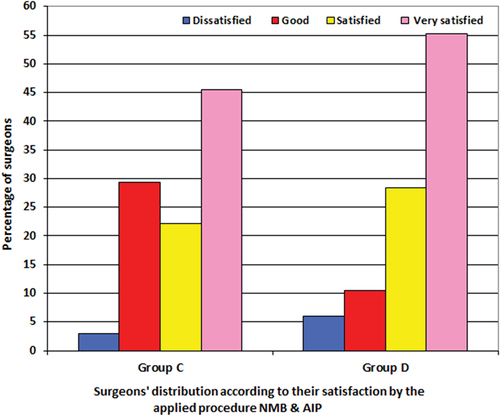
Table 5. Patients’ postoperative data.